1Dept of Clinical Chemistry, School of Medicine, University of Crete, Heraklion, Crete; 2Dept of Psychiatry, School of Medicine, University of Crete, Heraklion, Crete; 3Computational BioMedicine Laboratory, Institute of Computer Science, Foundation of Research and Technology-Hellas; Greece
OBJECTIVE: Adiponectin is the
major product of adipose tissue. The aim of this study was to associate
adiponectin levels with adipose tissue and metabolic indices.
DESIGN: Plasma
samples of 274 non-diabetic volunteers were collected to evaluate for
adiponectin, inflammatory markers, insulin and lipid parameters. Body fat
composition was measured by DEXA.
RESULTS: As expected, adiponectin levels
correlated with body mass index (BMI) and gender but a wide scattering was
evident. When the population was divided into two groups per median levels of
adiponectin (11.94 μg/mL), adiponectin was correlated with various
metabolic indices. Persons displaying relatively high adiponectin levels
[17.7(CI:14.8-21.0]μg/mL; MEDIAN (25%-75%)] exhibited lower levels
of inflammatory markers (hs-CRP, plasminogen, erythrocyte sedimentation rate),
circulating lipids and markers of insulin sensitivity (fasting blood glucose,
insulin, HbA1c and HOMA-IR) compared to those individuals displaying
low-adiponectin levels [8.9(CI:6.9-10.6)μg/mL]. The percentage
of high-adiponectin individuals decreased from 69.6% in the normal-BMI group to
36.5% in the obese-BMI group. Average adiponectin levels in the
high-adiponectin normal-BMI group were significantly higher compared to the
high-adiponectin obese-BMI group (p=0.014). Regarding body fat, only the
individuals with high adiponectin levels in either the combined population or
within the obese-BMI group displayed low levels of waist-to-hip ratio.
Interestingly, high-adiponectin levels within the obese-BMI group were
associated with higher legs fat than trunk fat as compared to the
low-adiponectin obese-BMI group.
CONCLUSIONS: Our data suggest that the
distribution of adiponectin above or below a cutoff level may offer additional
clinical information over and above that of BMI grouping regarding inflammatory
profile, insulin-sensitivity and adiposity.
Adiponectin scattering, Body fat, Insulin resistance, Chronic low grade inflammation, Obesity
INTRODUCTION
Adiponectin, the most abundant product of adipocytes, exerts multiple anti-inflammatory, anti-atherogenic and anti-diabetic effects.1-5 The levels of adiponectin decrease in obesity, the so-called obesity paradox, its expression suppressed by the pro-inflammatory cytokines and chemokines produced by the large adipocytes and activated macrophages of visceral adipose tissue in obesity.6–11 Lower levels of circulating adiponectin correlate inversely with insulin resistance and markers of inflammation.1–5
The main problem with adiponectin levels is their wide scattering. Indeed, individual adiponectin levels fluctuate markedly between individuals within the same body mass index (BMI) and total body fat group. The reason for these differences in adiponectin may be attributed to other factors modulating the expression of the adiponectin gene in addition to BMI and quantity of fat. Indeed, it is known that gender, age, physical activity, quality and quantity of food intake, smoking, alcohol drinking and several others parameters affect its levels.6 Thus, adiponectin levels are higher in women compared to men and in younger age groups compared to the elderly. Furthermore, in lifestyle intervention studies the levels of adiponectin increased before any change in BMI could be detected.7 It has been estimated that daily intake of carbohydrates, smoking frequency and levels of circulating cytokines, such as tumor necrosis factor alpha (TNFa), may account for as much as 50% of individual variability in adiponectinemia among normal-weight women as compared to only 10% of variance accounted for by abdominal fat.8 Likewise, the glycemic index (GI) of each meal can influence plasma adiponectin levels in patients with type 2 Diabetes Mellitus (T2DM) irrespective of their BMI.9 Thus, diets with high GI suppress adiponectin while those of low GI boost it.10 Another interesting observation is that adiponectin levels are lower in non-obese, non-diabetic first-degree relatives of patients with T2DM, as compared to weight-matched persons with no diabetic relatives, highlighting the role of life-style choices and patterns within each family.11 Furthermore, it has repeatedly been shown that BMI or waist circumference partly explains the association of adiponectin levels with insulin sensitivity.12 In addition, while the chronic low-grade inflammation of obesity has been associated with low adiponectin levels, higher levels of inflammation like those encountered in inflammatory or autoimmune diseases or even sepsis enhance rather than suppress adiponectin levels.13
The aim of the current study was to examine the significance of adiponectin scattering within our combined population as well as within each BMI group and associate it with metabolic indices including quantity and distribution of body fat, insulin resistance, lipid profile, inflammation markers and gender. Our data showed a wide scattering of adiponectin levels across our combined population and within each BMI group. Gender played a significant role in adiponectin irrespective of BMI or total body fat. Parsing the total population into high and low adiponectin subgroups, based on the population adiponectin median, was found to offer additional clinical information over and above that of BMI grouping.
MATERIALS AND METHODS
Ethics approval and consent to participate
The protocol was approved by the Ethics Committee of the University Hospital of Heraklion, Crete (protocol number 16901) and all participating subjects signed informed consent forms. The study was conducted in accordance with the principles for the conduct of human research of the Declaration of Helsinki.
Characteristics of the population studied
The study cohort consisted of 274 subjects (221 women and 53men) with no clinically evident health problems, on no medications or weight reducing diet [39.6 ± 12.9 years (MEAN ± SD)]. The participants were recruited through direct contact during regularly scheduled appointments for routine clinical evaluations (e.g. complete blood count checkup or other more specific tests appropriate for their health condition) at the primary care facilities. Participants were free of major and chronic autoimmune or inflammatory diseases. In the first part of the study, the population was divided into three groups as per BMI: normal-weight (BMI <25 kg/m2), overweight (BMI: 25–30 kg/m2) and obese groups (BMI >30 kg/m2). In the second part of the study, either the entire population or each BMI group was subdivided as per the median adiponectin level (11.94 μg/mL) into a high adiponectin and a low adiponectin group.
Body fat assessment
Waist and hip circumference were measured at the level of the umbilicus and gluteus, respectively. Height and weight were also measured to calculate BMI. Total body fat mass was determined by the body fat monitor BF306 (OMRON Healthcare Co. Ltd., Japan) based on the Bioelectrical Impedance Analysis (BIA) technique. In a subgroup of participants (n=108; n=19/13/74 for normal-weight/overweight/obese) body fat composition was determined using the dual energy X-ray absorptiometry (DEXA) by Lunar DPX (GE Healthcare, Madison, WI).14 The method distinguishes lean tissue mass (organs, muscle and fluids) from fat tissue mass and provides both total body and regional fat estimates (trunk, arms, peripheral-legs, pelvis and android/gynoid regions). The fat percentage was calculated using the electric resistance adjusted for anthropometric characteristics (height, weight) and gender.
Biochemical measurements
Blood samples were collected in the fasting state. Total, LDL, HDL–cholesterol, triglycerides and fasting glucose were measured by enzyme-colorimetric method using a Cobas 6000 analyzer (Roche Diagnostics, Indianapolis, IN, USA). Glycosylated haemoglobin (HbA1c) was measured by HPLC. Insulin was measured using a chemiluminescence assay by Access 2 Beckman Coulter (Beckman Coulter Foundation, Brea, CA, USA). High sensitivity CRP (hs-CRP) was measured by a turbidimetric assay. Erythrocyte sedimentation rate (ESR) was measured by the Westergren method and the coagulation of Plasminogen by BFT II (Dade Behring Holdings Inc., Deerfield, IL, USA). The turbidimetric assay (OQMP115) for the quantification of Serum Amyloid A (SAA) was purchased from Siemens (Siemens Healthcare Diagnostics GmbH, Eschborn, Germany). Interleukin (IL)6, IL8 and TNFa levels were measured by chemiluminescence on the Immulite analyzer (Siemens). Homeostasis model assessment of insulin resistance (HOMA-IR) was calculated using the formula: [(insulin (μU/mL)×glucose|(mg/dL)]/405.15 Adiponectin was measured by an ELISA assay; KHP0041 (Invitrogen Corporation, Camarillo, CA, USA). The sensitivity of the assay is 100 pg/mL, the intra-assay (%CV) is 3.4 and the inter-assay (%CV) is 4.3. Adiponectin in randomly selected participants was also checked by the ELISA assay (DRP300, R & D systems, Minneapolis, MN, USA) and found to be nearly the same as when measured by Invitrogen kit. The sensitivity of the R & D assay is 891 pg/mL, the intra-assay (%CV) is 4.7 and the inter-assay (%CV) is 6.9.
Statistical analyses
Statistical analyses were performed using the Statistical Package for the Social Sciences (SPSS) software (version 19.0; SPSS, IBM Corporation, Chicago, IL, USA). As often seen in biological data, distribution of many parameters analysed was found to be non-normal and highly skewed. Thus, where necessary, logarithmic transformations were applied to correct for significant positive skewness and transformed data were used in the analyses. Differences between BMI groups (normal-weight, overweight, obese) were examined through one way ANCOVAs on each parameter of interest controlling for age and gender.
Gender differences in adiponectin levels were assessed through a one-way ANCOVA controlling for age and BMI. To examine whether differences between BMI on adiponectin levels were dose-dependent we performed planned one-way ANCOVAs on adiponectin with the BMI group as the between-subjects variable, separately for participants in the high-adiponectin and the low-adiponectin groups. Age and gender served as covariates. The adiponectin and BMI subgroups were compared to the percentage of persons displaying high levels of adiponectin as per the population median value.
Systematic variability in fat distribution [total body and regional fat estimates (trunk, arms, peripheral-legs, pelvis and android/gynoid regions)] as a function of adiponectin and BMI groups (normal-weight, overweight, obese) was examined through two-way ANCOVAs controlling for age and gender. Significant two-way interactions were assessed through pairwise comparisons (low-adiponectin vs. high-adiponectin groups within each BMI group) which were evaluated by Bonferroni-corrected at p=0.017.
Multiple linear regression analyses were performed with adiponectin as the dependent variable and biochemical and anthropometric indices as the independent variables. Separate sets of models were tested in the entire population, in the high adiponectin and in the low adiponectin subgroup. Variables were entered in each model if their partial correlation coefficient with adiponectin was >0.1 (controlling for demographics).
RESULTS
Characteristics of the population studied
Pairwise group comparisons between the three BMI groups on anthropometric and biochemical indices are presented in Table 1. In agreement with previous reports, levels of adiponectin were significantly lower in the obese-BMI group [11.48±0.47; (MEAN±SE) μg/mL adiponectin] as compared to both the normal-BMI group (16.28±0.71μg/mL adiponectin; p<0.001) and the overweight-BMI group (14.25±0.73μg/mL adiponectin, p=0.002). In addition there was a progressive increase of the following biochemical markers with BMI as indicated by significant differences between normal-BMI and overweight-BMI groups (e.g. triglycerides; p<0.005, insulin; p<0.003, and insulin-resistance as indexed by HOMA-IR; p<0.001) and between the latter and the obese group ( Table 1). Significantly decreasing levels of HDL across the three groups were also noted (p<0.001) as well as an increase in the percentage of total body fat as measured by BIA (p<0.001) and the percentage of fat in the trunk (p<0.006). In addition, higher levels of the following inflammatory markers were found between the normal-BMI and obese groups: hsCRP (p<0.001), Plasminogen (p<0.001), ESR (p<0.001) and SAA (p=0.011) combined with an increase in the white blood cell count (p<0.001). Significant differences in virtually all biochemical markers measured in the present study (as well as in percentage of fat in the extremities) were noted between the normal-weight and the obese group ( Table 1).
Adiponectin levels and gender
In agreement with the majority of published reports, females exhibited significantly higher adiponectin plasma levels compared to males F (1,274) = 9.15, p=0.003 [14.08±6.15 vs. 11.38±5.50 (MEAN±SD) μg/mL], respectively.
The distribution of adiponectin levels in the population
In preliminary analyses we confirmed that the two different ELISA assays employed resulted in similar levels of individual variability in adiponectin measurements within each BMI group, which was considerable as shown in Figure 1.

Figure 1. Scattering of adiponectin levels in the population. Individual levels of adiponectin (μg/mL) in relation to body mass index (BMI).
Next, each BMI group was split into high-adiponectin and low-adiponectin subgroups using the population median as cutoff (11.94 μg/mL). Planned one-way ANCOVAs on adiponectin levels by the BMI group within each adiponectin subgroup (controlling for age and gender) revealed a significant main effect of the BMI group on the high-adiponectin group, F (1,132) = 4.32, p=0.015, which failed to reach significance in the low-adiponectin group (p=0.3). Follow-up pairwise comparisons revealed significantly higher adiponectin levels in the normal-BMI as compared to the obese group (p=0.014; Figure 2, upper graph). The overweight and obese groups did not differ significantly (p=0.1) and neither did the normal-BMI and overweight groups (p >0.9). However, the percentage of persons in the low adiponectin group was significantly higher in the obese (64.8%) as compared to both the normal-BMI (31.6%; X2[1] = 21.57, p<0.001) and overweight groups (43.3%; X2[1] = 8.36, p=0.003) (Figure 2, lower graph). These differences were present in both genders (p<0.01).
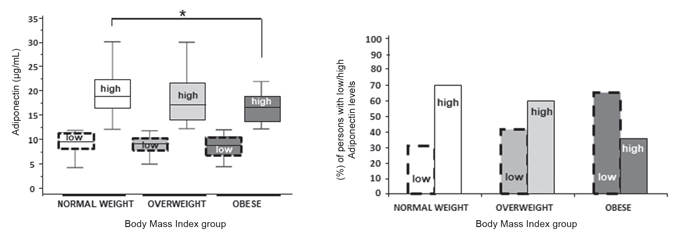
Figure 2. Distribution of adiponectin levels within each BMI group. (A) Schematic presentation of adiponectin groups divided as per their BMI and median adiponectin levels. (B) Percentage (%) of persons within each BMI group having low- or high-adiponectin levels. Statistically significant differences between normal-weight high-adiponectin and obese high-adiponectin subgroups (Bonferroni adjusted p <0.017) are indicated by asterisks.
The inflammatory, lipid, insulin-resistance and obesity profiles of the low- adiponectin and high-adiponectin groups in the combined population
Participants in the low-adiponectin and high-adiponectin groups were comparable as to age (p>0.5) and gender distribution (p>0.1) but differed in several inflammatory, lipid and obesity parameters (Table 2). Specifically, the high-adiponectin group had lower levels of inflammatory indices (hs-CRP, p=0.006; PLASM, p<0.001; ESR, p=0.003), triglycerides (p<0.001), glucose (p=0.003), insulin (p=0.001), HbA1c (p=0.011), HOMA-IR (p<0.001), BMI (p<0.001), waist-to-hip ratio (p<0.001) and proportion of total body fat (p = 0.005) and higher HDL levels (p<0.001). The effects of the adiponectin group on triglycerides (p=0.01), HDL (p=0.001), glucose (p=0.030), HOMA-IR (p=0.030), and plasminogen (p=0.024) remained significant after controlling for BMI.
Relative adiponectin levels were also associated with region-specific fat accumulation (n=108). High levels of adiponectin were associated with lower ratio of trunk/total fat [0.51 (0.45–0.55), n=47] compared to the same ratio in the low-adiponectin group [0.53 (0.49–0.57), n=61, p=0.040]. The reverse trend was evident for the ratio of legs/total fat [high-adiponectin group; 0.38 (0.33–0.43), low-adiponectin group; 0.35 (0.31–0.40), p=0.028] and the ratio of arms and legs to trunk fat [high-adiponectin group; 0.90 (0.75–1.15), low-adiponectin group; 0.80 (0.66–1.00), p=0.020].
Within the obese-BMI group, the adiponectin subgroups varied in body fat distribution
The classification of obese participants as per the median levels of adiponectin revealed an association of adiponectin with the distribution of body fat. Thus, obese individuals displaying high-adiponectin levels (n=24) had significantly higher percentages of trunk fat (54.44% ± 1.37%; MEAN ± SE, p=0.036) and legs fat (57.32% ± 0.89%, p=0.019) compared to obese individuals displaying low-adiponectin levels (52.08% ± 0.76% and 50.87% ± 1.50%, respectively; n=47). However, the average group difference in the percentage of peripheral fat was three times higher (6.5%) than the corresponding difference in the percentage of trunk fat (2.4%). Consistent with this finding, obese individuals with high adiponectin levels displayed smaller waist-to-hip ratio than the obese individuals displaying lowadiponectin levels (p=0.048) (Figure 3).
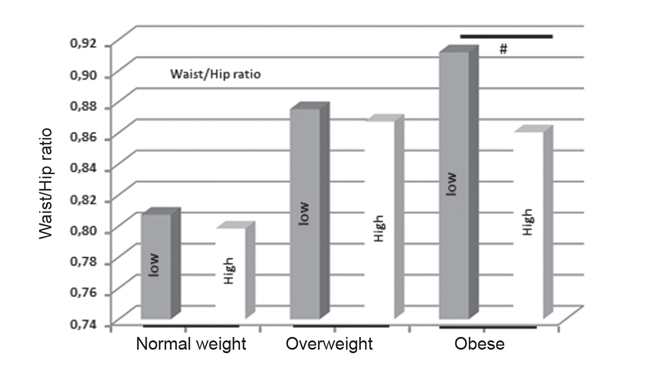
Figure 3. Waist-to-hip ratios according to BMI and adiponectin levels. High-adiponectin and low-adiponectin subgroups were defined according to the population median adiponectin value (11.94 μg/mL). Statistically significant differences between high- and low-adiponectin obese subgroups (p<0.05) are indicated by a # sign.
Factors associated with adiponectin levels
Due to the strong collinearity between anthropometric measures (BMI, waist circumference, proportion of total body fat, WHR) they were entered into each multiple linear regression model separately (Table 3). In the entire sample, higher adiponectin levels were associated with smaller waist-to-hip ratio (p=0.020) and higher HDL values (p=0.030). In the high-adiponectin group, higher levels of adiponectin were associated with lower HOMA-IR values (p=0.027) whereas in the low-adiponectin group, higher levels of adiponectin were associated with lower levels of triglycerides (p=0.030) (Table 3).
DISCUSSION
The aim of the current study was to examine the clinical relevance of adiponectin scattering in the population and associate it with several metabolic indices including quantity and distribution of body fat, lipid profile, inflammation markers and insulin resistance.
Adiponectin is the sole adipokine that diminishes in obesity. However, there are no established physiological levels, most probably because they vary widely between individuals of the same BMI. In this report, we have assessed the percentage of high and low adiponectin individuals judged as per the population median of adiponectin (11.94 μg/mL). In spite of the notable scattering of adiponectin levels within each BMI group, there was a progressive reduction in the percentage of persons with high adiponectin levels between normal-weight (69.6%), overweight-BMI (59.7%) and obese-BMI groups (36.5%). Furthermore, average adiponectin levels were significantly higher in the high-adiponectin/normal-BMI subgroup as compared to the high-adiponectin/obese-BMI subgroup. The fact that there were individuals with high adiponectin levels even in the obese group was not due to higher concentrations of adiponectin in females since it was observable not only in our combined population but also in the male and female subgroups. Thus, obesity appears to be an important factor that explains the decreasing probability of finding individuals with high adiponectin levels among normal-weight to obese individuals. Importantly, average adiponectin levels did not vary significantly across the three low-adiponectin BMI subgroups. These findings may account for the considerable scattering of adiponectin levels in the entire population and the lack of a significant association between adiponectin and BMI in the present sample. So far, it seems that BMI and gender may account for the differences in adiponectin, though obviously other factors may also play a significant role in the wide scattering of adiponectin levels.
Another interesting observation in this study was that in both the combined population as well as within each BMI group, adiponectin levels were strongly associated with the quantity and distribution of body fat. In general, the higher the adiponectin level the lower the trunk fat and the higher the peripheral / subcutaneous fat as indicated by the measurements of region-specific fat accumulation and the waist-to-hip ratio. Our data regarding adiponectin levels and fat distribution are comparable with those reported for animals, where mice over-expressing the adiponectin gene had lower accumulation of fat in their liver compared to the wild mice, suggesting a lower accumulation of fat in the central/visceral depot.16
We also found that even in the obese-BMI group the scattering of adiponectin is considerable, with a percentage of individuals displaying relatively high levels. Obese individuals with higher adiponectin levels had a higher percentage of peripheral fat compared to visceral fat, indicating a possible better prognosis compared to the obese individuals with lower adiponectin levels. The association of adiponectin with peripheral fat distribution is also documented in a study of mice over-expressing adiponectin where the enhanced adiponectin levels were associated with increased expansion of subcutaneous adipose tissue.16 Our data also agree with previous reports, where metabolically healthy obese displayed elevated adiponectin levels compared to those obese with metabolic complications.17,18 Although the definition of metabolic health was based on a range of cardiometabolic abnormalities, these studies suggested that obese individuals with adiponectin levels above the median (2.6 to 4 times) have an increased probability of being metabolically healthy.19–21
Although measurement of waist circumference remains clinically helpful, it does not distinguish accurately between those with subcutaneous fat versus those with visceral fat. In these cases, adiponectin may serve as a complementary serum marker. In our study, we used either the measurement of the anthropometric parameters (BMI, waist and hip circumferences) or more advanced methodologies (including DEXA or BIA) for fat composition and distribution. All these methods exhibited the same association with adiponectin levels.
Obesity is a clinical condition characterized by progressively diminishing adiponectin levels and is in turn associated with the development of a pro-inflammatory profile resulting in insulin resistance and arteriosclerosis. Several pro-inflammatory substances are produced by the obese adipose tissue (by both adipocytes and activated monocytes/macrophages) and this pro-inflammatory reaction is eventually spread throughout the body, a phenomenon known as the systemic low-grade inflammation of obesity. Adiponectin is almost exclusively produced by adipocytes with numerous studies demonstrating the direct in vitro effects of adiponectin on the reduction of inflammatory substances and vice versa.4,5,22-24 In population studies, correlational analyses typically demonstrate an indirect and weak link between adiponectin and inflammatory factors.25 In the present study, median-split subgrouping revealed a strong and inverse correlation between adiponectin and well-known inflammatory markers regardless of obesity status. Indeed, hs-CRP, plasminogen and ESR were both decreased in people with high adiponectin levels irrespective of their BMI. The close relationship between adiponectin levels and inflammatory markers suggests that other factors beyond body weight play a crucial role in augmenting adiponectin production, such as exercise and dietary habits. Thus, the levels of adiponectin may serve as an index of the inflammatory status of a given person, lean or obese.
The development of hyperlipidemia is one of the chief metabolic complications of obesity. In our study, high adiponectin was a strong indicator of a healthier lipid profile in the combined population regardless of BMI levels. Our findings are in agreement with the existing literature showing a favorable effect of adiponectin on lipid profile, as recently reported in humans.26,27 Supplementary regression analysis results suggest that the direct association between lipid markers (triglycerides) and adiponectin levels is stronger among persons displaying relatively lower levels of adiponectin. A possible mechanism for this association was proposed in mice over-expressing adiponectin where the enhanced adiponectin levels were associated with a higher clearance of circulating fatty acids and an improved sensitivity to the lipolytic effects of adrenergic agonists.16
Our data also show that those individuals with high adiponectin levels irrespective of BMI were more insulin-sensitive compared to those exhibiting low adiponectin levels and regression analyses confirmed the direct association between individual adiponectin levels and HOMA-IR values. The protective role of adiponectin in insulin sensitivity has been documented in several studies.28,29 A direct association between insulin-sensitivity and peripheral fat distribution was reported in an urban female sample where normal-weight and obese persons exhibiting insulin-resistance had higher total and visceral adiposity irrespective of their BMI.30 Moreover, fasting plasma glucose levels were comparable between normal-weight and obese women but visceral fat mass was an important determinant of the insulin-resistance phenotype. In a different ethnic group large hip circumference (indicating large amounts of subcutaneous fat) was directly associated with lower glucose levels.31 Although the sample size in the present study did not permit separate regression analyses within each BMI and adiponectin level subgroup, group-level comparisons may suggest that the protective role of adiponectin in insulin sensitivity was shown to extend to and even may encompass individuals without severe adiposity because it can link the levels of adiponectin with changes in visceral versus peripheral/subcutaneous fat distribution with crucial repercussions in insulin-sensitivity.
Finally, a few comments regarding the differences between the available assays for measuring adiponectin. Although the more biologically active form of adiponectin appears to be the high molecular weight form rather than the total form or the low molecular weight form, it has been shown that total adiponectin appears to be a superior marker of insulin resistance and correlates better with HDL-cholesterol, TG, insulin levels and circulating inflammatory markers compared to the HMW form of adiponectin.32,33 In our study, we used two different kits to measure total adiponectin levels in order to evaluate if limitations or biases of each ELISA assay (e.g., their sensitivity) may be responsible for the observed wide scattering of adiponectin levels even within each BMI group. We found that the observed scattering was not affected by the type of assay used.
CONCLUSIONS
Our data suggest that the measurement of adiponectin could serve as a sensitive and earlier marker to identify those individuals that could be at risk of developing hyperlipidemia, central adiposity, low-grade systemic inflammation and insulin resistance irrespective of their BMI. Thus, the subgrouping of the population as per the median levels of adiponectin may offer clinically relevant information for the metabolic profile of each individual patient.
FUNDING
This work was supported by the Hellenic Secretariat for Research and Technology (Contract grant number: KA296/KA3330) and the EU and national funds under the action Education and lifelong learning, program THALIS-FAT-VESSEL (Contract grant number: 379527).
DISCLOSURE
None of the authors have any potential conflicts of interest associated with this research.
REFERENCES
1. Arita Y, Kihara S, Ouchi N, et al, 1999 Paradoxical decrease of an adipose-specific protein, adiponectin, in obesity. Biochem Biophys Res Commun 257: 79-83.
2. Ley SH, Harris SB, Connelly PW, et al, 2008 Adipokines and incident type 2 diabetes in an Aboriginal Canadian [corrected] population: the Sandy Lake Health and Diabetes Project. Diabetes Care 31: 1410-1415.
3. Kishida K, Kim KK, Funahashi T, et al, 2011 Relationships between circulating adiponectin levels and fat distribution in obese subjects. J Atheroscler Thromb 18: 592-595.
4. Shehzad A, Iqbal W, Shehzad O, Lee YS, 2012 Adiponectin: regulation of its production and its role in human diseases. Hormones (Athens) 11: 8-20.
5. Sadashiv, Tiwari S, Paul BN, et al, 2013 Adiponectin mRNA in adipose tissue and its association with metabolic risk factors in postmenopausal obese women. Hormones (Athens) 12: 119-127.
6. Cnop M, Havel PJ, Utzschneider KM, et al, 2003 Relationship of adiponectin to body fat distribution, insulin sensitivity and plasma lipoproteins: evidence for independent roles of age and sex. Diabetologia 46: 459-469.
7. Cambuli VM, Musiu MC, Incani M, et al, 2008 Assessment of adiponectin and leptin as biomarkers of positive metabolic outcomes after lifestyle intervention in overweight and obese children. J Clin Endocrinol Metab 93: 3051-3057.
8. Silva-Nunes J, Oliveira A, Duarte L, et al, 2013 Factors related with adiponectinemia in obese and normal-weight women and with its variation in weight loss programs. Obes Facts 6: 124-133.
9. Loh BI, Sathyasuryan DR, Mohamed HJ, 2013 Plasma adiponectin concentrations are associated with dietary glycemic index in Malaysian patients with type 2 diabetes. Asia Pac J Clin Nutr 22: 241-248.
10. Mente A, Razak F, Blankenberg S, et al, 2010 Ethnic variation in adiponectin and leptin levels and their association with adiposity and insulin resistance. Diabetes Care 33: 1629-1634.
11. Liu J, Wang F, Cha Y, Chen ZP, Ding HY, 2010 Adiponectin levels in non-obese first-degree relatives of type 2 diabetes patients and non-diabetic subjects: a 5-year follow-up study. J Int Med Res 38: 792-802.
12. Gao H, Fall T, van Dam RM, et al, 2013 Evidence of a causal relationship between adiponectin levels and insulin sensitivity: a Mendelian randomization study. Diabetes 62: 1338-1344.
13. Vassiliadi DA, Tzanela M, Kotanidou A, et al, 2012 Serial changes in adiponectin and resistin in critically ill patients with sepsis: associations with sepsis phase, severity, and circulating cytokine levels. J Crit Care 27: 400-409.
14. Snijder MB, van Dam RM, Visser M, Seidell JC, 2006 What aspects of body fat are particularly hazardous and how do we measure them? Int J Epidemiol 35: 83-92.
15. Iwashima Y, Katsuya T, Ishikawa K, et al, 2004 Hypoadiponectinemia is an independent risk factor for hypertension. Hypertension 43 :1318-1323.
16. Asterholm IW, Scherer PE, 2010 Enhanced metabolic flexibility associated with elevated adiponectin levels. Am J Pathol 176: 1364-1376.
17. Phillips CM, Perry IJ, 2013 Does inflammation determine metabolic health status in obese and nonobese adults? J Clin Endocrinol Metab 98: E1610-1619.
18. Berezina A, Belyaeva O, Berkovich O, et al, 2015 Prevalence, Risk Factors, and Genetic Traits in Metabolically Healthy and Unhealthy Obese Individuals. Biomed Res Int 2015: 548734.
19. Meigs JB, Wilson PW, Fox CS, et al, 2006 Body mass index, metabolic syndrome, and risk of type 2 diabetes or cardiovascular disease. J Clin Endocrinol Metab 91: 2906-2912.
20. Karelis AD, Brochu M, Rabasa-Lhoret R, 2004 Can we identify metabolically healthy but obese individuals (MHO)? Diabetes Metab 30: 569-572.
21. Wildman RP, Muntner P, Reynolds K, et al, 2008 The obese without cardiometabolic risk factor clustering and the normal weight with cardiometabolic risk factor clustering: prevalence and correlates of 2 phenotypes among the US population (NHANES 1999-2004). Arch Intern Med 168: 1617-1624.
22. Bruun JM, Lihn AS, Verdich C, et al, 2003 Regulation of adiponectin by adipose tissue-derived cytokines: in vivo and in vitro investigations in humans. Am J Physiol Endocrinol Metab 285: E527-533.
23. Tilg H, Moschen AR.,2006 Adipocytokines: mediators linking adipose tissue, inflammation and immunity. Nat Rev Immunol 6: 772-783.
24. Kern PA, Di Gregorio GB, Lu T, Rassouli N, Ranganathan G, 2003 Adiponectin expression from human adipose tissue: relation to obesity, insulin resistance, and tumor necrosis factor-alpha expression. Diabetes 52: 1779-1785.
25. Rajkovic N, Zamaklar M, Lalic K, et al, 2014 Relationship between obesity, adipocytokines and inflammatory markers in type 2 diabetes: relevance for cardiovascular risk prevention. Int J Environ Res Public Health 11: 4049-4065.
26. Lubkowska A, Radecka A, Bryczkowska I, et al, 2015 Serum Adiponectin and Leptin Concentrations in Relation to Body Fat Distribution, Hematological Indices and Lipid Profile in Humans. Int J Environ Res Public Health 12: 11528-11548.
27. Herder C, Ouwens DM, Carstensen M, et al, 2015 Adiponectin may mediate the association between omentin, circulating lipids and insulin sensitivity: results from the KORA F4 study. Eur J Endocrinol 172: 423-432.
28. Yamauchi T, Kamon J, Minokoshi Y, et al, 2002 Adiponectin stimulates glucose utilization and fatty-acid oxidation by activating AMP-activated protein kinase. Nat Med 8: 1288-1295.
29. Kadowaki T, Yamauchi T, 2005 Adiponectin and adiponectin receptors. Endocr Rev 26: 439-451.
30. Jennings CL, Lambert EV, Collins M, et al, 2008 Deerminants of insulin-resistant phenotypes in normal-weight and obese Black African women. Obesity (Silver Spring) 16: 1602-1609.
31. Snijder MB, Zimmet PZ, Visser M, et al, 2004 Independent association of hip circumference with metabolic profile in different ethnic groups. Obes Res 12: 1370-1374.
32. Almeda-Valdes P, Cuevas-Ramos D, Mehta R, et al, 2010 Total and high molecular weight adiponectin have similar utility for the identification of insulin resistance. Cardiovasc Diabetol 9: 26.
33. Aso Y, Yamamoto R, Wakabayashi S, et al, 2006 Comparison of serum high-molecular weight (HMW) adiponectin with total adiponectin concentrations in type 2 diabetic patients with coronary artery disease using a novel enzyme-linked immunosorbent assay to detect HMW adiponectin. Diabetes 55: 1954-1960.
Address for correspondence:
Andrew N. Margioris, Lab of Clinical Chemistry, Department
of Laboratory Medicine, School of Medicine, University of Crete, Heraklion GR-710 01, Crete, Greece; Tel.: +30 2810-394588, Fax: +30 2810-394571, E-mail: andym@med.uoc.gr
Received: 09-03-2017, Accepted: 05-11-2017