1Departamento de Biología Molecular y Celular, Facultad de Veterinaria, Universidad de la República, Lasplaces, Montevideo, Uruguay; 2Laboratório de Etologia Aplicada, Departamento de Zootecnia e Desenvolvimento Rural, Universidade Federal de Santa Catarina, Rodovia Admar Gonzaga, Florianópolis, Brazil; 3Instituto Nacional de Investigación Agropecuaria, La Estanzuela, Colonia, Uruguay; 4Departamento de Fisiología, Facultad de Veterinaria, Universidad de la República, Lasplaces, Montevideo, Uruguay
OBJECTIVE: In rodents,
progesterone (P4) pretreatment increases anxiety and response to stressors.
Social isolation is a stressor that generates physiological and behavioural
stress responses in sheep. The aim of the study was to compare the stress
response of anoestrous ewes previously treated or not with P4 to the social
isolation test.
DESIGN: Ten ewes received P4 treatment during 13 d (group P4-W)
and another 10 remained untreated as controls (group Con). The ewes were
individually isolated in a novel place during 10 min, 24 h after the end of P4
pretreatment and their behaviours were recorded. Cortisol and P4 concentrations
as well as body surface temperature were recorded before and after the test.
RESULTS: Ewes of the P4-W group presented higher cortisol levels 0, 10, 20 and
30 min after the social isolation and had greater area under the curve of
cortisol compared to Con ewes (41,785%±4,156% vs. 25,682%±4,565% during 75
min). Progesterone and body surface temperature increased after social
isolation, with no differences between P4-W and Con ewes. There were no
differences in behavioural responses to social isolation.
CONCLUSIONS: P4
pretreatment appears to augment the stress response to social isolation in
anoestrous ewes.
Behaviour, Body temperature, Cortisol, Open field test, Sheep
INTRODUCTION
Progesterone (P4) reduces the stress response in rodents through neuroactive metabolites that contain the 3α-hydroxy group.1,2 These metabolites produce anxiolytic and sedative effects through binding to γ-amino butyric acidA (GABAA) receptor,3 thereby reducing the neuroendocrine and behavioural response to stressors.4,5 In ewes, P4 administration reduces the behavioural and physiological responses to weaning, a strong stressor.6 On the other hand, it has also been reported that reduction of P4 in rodents – as is observed immediately after luteolysis − has anxiogenic effects through a decrease in the inhibitory effect of GABA.7 Thus, the animals have an increased sensitivity to stressors, as for example the open field test.8 Crossley et al9 demonstrated that these metabolites bind to the GABAA receptor of central nervous system tissue of sheep in vitro, indicating that this could be the pathway of its anxiolytic and anxiogenic effects.
As sheep are gregarious animals,10 individual isolation from the flock provokes an important stress response.11 Therefore, the open field test is a standardized test used to evaluate the stress response of sheep to social isolation.12 In this test, sheep are individually introduced into an unfamiliar and isolated environment for a certain period of time.13,14 Socially isolated sheep show behavioural responses indicative of stress, such as an increase in locomotion, the number of vocalizations, urinations and defecations and a reduction in the number of exploratory behaviours,12 as well as increases in cortisol concentration15 and rectal temperature.16 Although an increase in P4 concentration has not been observed in response to social isolation, it has been reported that P4 in ewes increases in response to ACTH administration17 and after transportation.18
Considering all this information, ewes should respond strongly to stressors after P4 pretreatments. Taking all the above into consideration, ewes should be more sensitive to stressors after traditional hormonal treatments applied for oestrous synchronization and artificial insemination, given that the P4 leveles (and thus its neuractive metabolites) change acutely following this procedure. We hypothesized that anoestrous ewes are more sensitive to social isolation after P4 concentrations have been withdrawn. Thus, the aim of the study was to compare the stress response to social isolation of anoestrous ewes previously treated or not with P4.
EXPERIMENTAL ANIMALS AND METHODOLOGY
Location and animal management
All the procedures were approved by the Comisión Honoraria de Experimentación Animal of the Facultad de Veterinaria, Universidad de la República, Uruguay. The study was performed at Estación Experimental La Estanzuela of the Instituto Nacional de Investigación Agropecuaria (INIA), Uruguay (34º28’S) during the non-breeding season (September-October, spring). Twenty nulliparous Polwarth ewes that weighed 40.3±0.8 kg (mean±SEM) and had a body condition score of 2 (median, min=1.75; max=2.5; in a 1 to 5 scale, where 1=emaciated and 5=obese) were used in the experiment. Ewes were assigned to two experimental groups (n=10 each), which grazed the same pasture of white clover and lucerne, in separated paddocks (50 m x 25 m), with free access to water. All ewes were shorn 20 d before the experiment started.
Experimental treatments
Both experimental groups were homogeneous for body weight and body condition score. While 10 ewes received an intravaginal P4 releasing device [Controlled Internal Drug Releasing (CIDR), 0.3 g P4; Pfizer, Auckland, New Zealand] for 13 d (group P4-W), the other 10 ewes remained as untreated controls (group Con). To avoid the effects of acute change of housing interfering with experimental results and to make it easier to catch and sample the ewes, 3 d before the test was performed all the ewes were moved to two pens (10m×10m) located 30 m from the place where the social isolation test was going to be performed. During those days the ewes received lucerne hay and water ad libitum.
Progesterone profile group
To characterize the P4 profile during and after CIDR treatment while avoiding excessive management of the experimental ewes, we collected blood samples from another 5 ewes (body weight = 40.2±1.80 kg; body condition score ranged from 2 to 2.25) from the same flock, which were managed similarly. These ewes received a CIDR for 13 d (P4-profile group) and were bled by jugular venipuncture on Days 0, immediately before CIDR insertion (Day 0=CIDR insertion), 1, 2, 3, 7, 10 and 13 during CIDR treatment, and 4, 8, 20 and 26 h after CIDR withdrawal.
Social isolation test
The ewes were individually moved to the social isolation pen where they remained for 10 min. After this test, the ewes were moved to another pen (6.0m×6.0m) where other ewes from the same flock were housed and where they remained during the entire sampling period. The social isolation pen measured 3.0m×3.5m, 1.5m high, and had black walls. The floor was painted to mark 16 squares of equal size. During the social isolation test, the ewes had no visual, olfactive or auditive interactions with humans or the other animals, which remained at a minimum distance of 20 m.
The social isolation test was performed 24 h after CIDRs were withdrawn in the P4-W ewes. CIDRs were placed in 5 animals for each treatment on day one and on another 5 the following day and likewise withdrawn also with 24 h of difference to homogenize the time from CIDR withdrawal and avoid differences in the time of the day in which the ewes were tested. Therefore, the tests were performed during two consecutive days, thus testing 5 ewes from each group each day. All tests were performed between 08:00 h and 13:00 h. The ewes were tested at intervals, one from each group at a time. Two ewes, one from each group, escaped from the pen during the test so their data were not considered.
Blood samples
Blood samples were collected by jugular venipuncture 11 and 2 d before CIDR insertion to confirm the anoestrous condition with P4 concentrations. Samples were also taken 5 min before the test, immediately after (0 min) and 10, 20, 30, 45 and 60 min after the test. Blood samples were centrifuged at 1500 x g for 10 min and the serum was separated and frozen at -20ºC.
Cortisol and progesterone measurements
Cortisol concentration was determined on serum from all samples collected before and after the social isolation test. Serum cortisol concentration was measured at the Laboratorio de Técnicas Nucleares, Facultad de Veterinaria, Montevideo, Uruguay, using a solid-phase radioimmunoanalysis kit (Coat-a-Count, Siemens, Los Angeles, CA, USA). The analytical sensitivity of the assay was 19.04 nmol/L and the intra-assay coefficient of variation was 11.7%.
Progesterone concentration was measured on serum samples collected 11 and 2 d before CIDR insertion to confirm the anoestrous status of the ewes, considering P4 concentration >3.2 nmol/L as luteal value 19. Progesterone concentration was measured on the samples collected 5 min before and immediately after the social isolation test and 30 min later. Progesterone was also measured on all serum samples collected in the P4-profile group of the ewes. Serum P4 concentration was measured at the Laboratorio de Técnicas Nucleares, Facultad de Veterinaria, Montevideo, Uruguay, using a solid-phase radioimmunoanalysis kit (Coat-a-Count, Siemens, Los Angeles, CA, USA). The analytical sensitivity of the assay was 0.25 nmol/L and the intra-assay coefficient of variation was 10.7%.
Body surface temperature
Surface temperatures were recorded on the skin of the left thorax and abdominal areas, in the medial region, using a laser thermometer (IR-102 Infrared Thermometer, Super Elec. Equip. Co, China), simultaneously to blood collection, until 45 min after the social isolation test.
Behavioural recordings
Two digital cameras recorded the ewes’ activities continuously during the social isolation. The following variables were analyzed from the videos: the number of lines crossed, vocalizations, eliminations (urinations + defecations), sniffing, escape attempts, freezing, latencies to first vocalization and elimination and the time that each ewe remained on the periphery squares.
Statistical analysis
The percentages at which cortisol and P4 concentration changed were determined considering the initial value (before the social isolation test) as 100%. The area under the curve for cortisol and P4 were calculated using GraphPadPrism Demo (GraphPad Software, Inc., San Diego, USA). Cortisol concentrations of P4-W and C ewes before the social isolation test were compared by ANOVA. Body surface temperature and the percentages at which cortisol and P4 concentrations changed were compared between treatments with the mixed model of SAS. The model considered the treatments (P4-W vs. Con), the time, as well as the interaction between treatments and time as fixed effects, and the ewe within each group as a random effect. Post-hoc comparisons were performed with LSD. The area under the curve of cortisol and the frequency of each type of behaviour, excepting eliminations and escape attempts, were compared using ANOVA. The frequency of eliminations and escape attempts, which did not have normal distribution, was compared with the Mann-Whitney test. The latencies and occurrences of vocalizations and eliminations were analyzed using the survival test. Data are presented as mean±SEM.
RESULTS
Description of the progesterone treatment
Progesterone concentration in P4-profile ewes during P4 treatment and after CIDRs withdrawal is presented in Figure 1. Progesterone concentrations increased on Day 1, remaining high until Day 4, and in luteal concentrations until CIDR withdrawal. P4 returned to basal concentrations 4 h after CIDRs were removed (Figure 1).
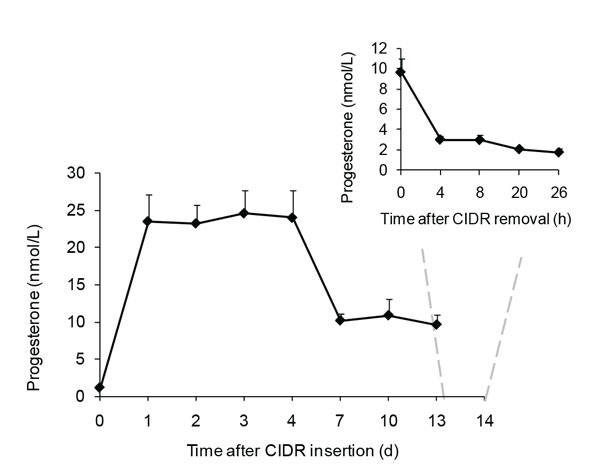
Figure 1. Progesterone concentrations (mean ± SEM) in five ewes treated with progesterone releasing device (CIDR) for 13 d. Time refers to days and hours during CIDR treatment and withdrawal. The inserted graph shows the P4 values on Day 13 and after CIDR withdrawn.
Cortisol
Cortisol concentrations of P4-W and Con ewes before the social isolation were 24.3±2.8 and 30.3±4.0 nmol/L, respectively (P = 0.14). Cortisol concentration increased after the social isolation test (P <0.001) in both groups, reaching maximum concentration at 20 (P <0.001) min, and did not return to initial concentrations until 60 min after the social isolation test (P <0.001) (Figure 2). Ewes of the P4-W group presented a greater cortisol concentration than Con ewes (P = 0.04; Figure 2). There was an interaction between time and treatment in the change of cortisol concentration (P = 0.008): the increase in P4-W ewes was greater 0, 10, 20 and 30 min after the social isolation test than in Con ewes (P <0.02; Figure 2). P4-W ewes also tended to have a greater increase of cortisol than Con ewes 45 min after the social isolation test (P = 0.08). Moreover, P4-W ewes had greater area under the curve for cortisol concentration than Con ewes (41,785%±4,156% vs. 25,682%±4,565% during 75 min; P = 0.02).
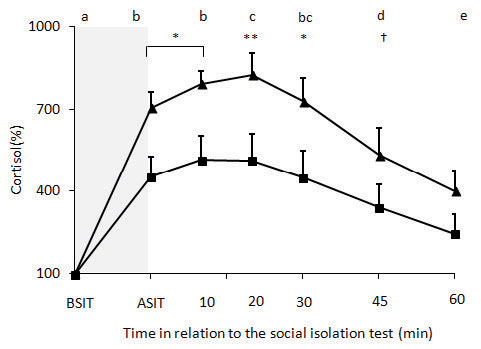
Figure 2. Cortisol changes before and after social isolation of ewes treated for 13 d with progesterone-releasing devices (CIDR), which was withdrawn 24 h before the social isolation test (-▲-) and in untreated control ewes (-■-). BSIT: cortisol concentration 5 min before social isolation test; ASIT: cortisol concentration immediately after social isolation test. The shaded area shows the period of the social isolation test. Different letters indicate that these points differ over time (P <0.0001). Asterisks indicate differences between groups: * = P <0.05; ** = P <0.01; † indicate tendency for differences between groups (P = 0.08).
ProgesteroneAs treatments did not affect P4 concentration after the social isolation test, data from both groups are presented pooled (Figure 3). Progesterone concentrations before the social isolation was 1.44±0.15 nmol/L. P4 concentration increased immediately after the social isolation test (P <0.001) and remained elevated 30 min after the test (P <0.001).
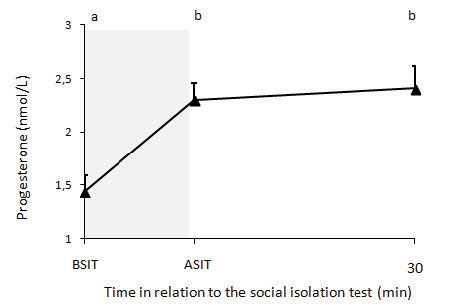
Figure 3. Progesterone changes in ewes before and after social isolation test. BSIT: progesterone concentration 5 min before the social isolation test; ASIT: progesterone concentration immediately after the social isolation test. Shaded area shows the period of the social isolation test. Different letters indicate significant differences over time (P <0.0002).
Body surface temperature
Body surface temperatures on the thorax (P <0.03) and abdomen (P <0.03) increased after the social isolation test without significant differences between groups. Data from both groups are presented pooled in Figure 4.
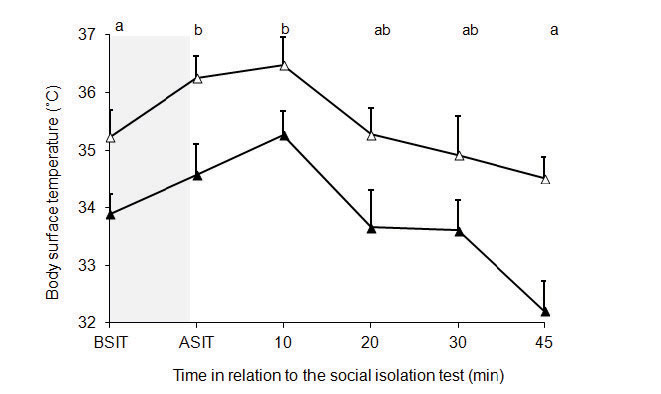
Figure 4. Body surface temperature on the thorax (-▲-) and abdomen (-▲-) of ewes after the social isolation test. BSIT: temperature values 5 min before social isolation test; ASIT: temperature values immediately after social isolation test. Shaded area shows the period of the social isolation test. Different letters indicate significant differences over time (P <0.03).
Behavioural recording
The P4-W and Con groups did not present differences in the frequency of any behaviour recorded during the social isolation test (Table 1).
DISCUSSION
This is the first study that demonstrates that pretreatment with P4 increases the physiological stress response to social isolation in ewes. The use of anoestrous ewes, which have very low oestrogen concentrations and do not ovulate after a single P4 treatment such as that applied in this experiment, allows us to isolate the P4 effects from possible effects of oestrogen increases after P4 concentrations decrease. This means that the physiological status of different ewes should be considered when temperament tests are performed, while management systems should also consider physiological status to minimize welfare problems. After social isolation, the changes in cortisol, the main endocrine indicator of an acute stress response in sheep,20,21 were greater in P4-W ewes. Although it is known that CRF, ACTH and glucocorticoids have direct stimulating effects on the behavioural response to stressors,22,23 we did not observe differences between the groups in the behavioural displays during the social isolation test. One explanation could be that differences in the CRF, ACTH and/or cortisol responses were not strong enough to induce differences in the behavioural response, or alternatively, the neuroendocrine changes were restricted to the adrenal level. Overall, this result provides support to the hypothesis that the decrease in P4 concentrations increases the sensitivity of the hypothalamic-pituitary-adrenal axis to stressors.
Overall, we observed responses in cortisol and body temperature and typical behavioural responses displayed by ewes exposed to a social isolation test.13,14,16 We also observed an increase of P4 concentrations after social isolation. As it has been previously reported that the administration of ACTH induces a P4 response of adrenal origin,17,24 P4 changes may also be considered a reliable indicator of a stress response. An increase in body surface temperature was also a component of the stress response. Although it is widely known that rectal temperature increases during a stress response,16,25 the use of body surface temperature has the advantage of being non-invasive and fast to measure; as the animals need to be immobilized for a shorter period, this may reduce the stress caused by the procedure. Our results provide support to include these two variables in future studies of stress response in sheep.
When the experiment was designed there were no data in the literature showing the pattern of P4 reduction after a CIDR treatment in anoestrous ewes. Moreover, there was no information on the changes of sensitivity to stressors according to the different time lengths after the P4 treatment ended. The length of P4 treatment or the interval between P4 treatment ended and the application of the social isolation test may have limited the responses of the ewes. We tested the ewes 24 h after the CIDR withdrawal based on the assumption that P4 concentrations would have returned to basal concentrations shortly before that. However, P4 concentrations had returned to basal levels approximately 20 h earlier, just 4 h after CIDR withdrawal, which could mean that the period of maximum sensitivity to stressors might have ended some hours earlier. Another consideration should be the length of treatment, as maximum P4 concentrations were achieved earlier and decreased slowly until the moment of CIDR withdrawal. Corroborating this, in a later study we observed an increase in reactivity of female calves to humans 16 h after CIDRs withdrawal following 5 d of treatment (Magri G, Freitas-de-Melo A, Ungerfeld R, unpublished results). It may therefore be interesting to test whether the responses are greater if the CIDRs are removed earlier when P4 values are maximum (e.g., Day 4 of the treatment). Thus, a shorter CIDR treatment combined with the application of the stressor earlier after P4 concentrations reduction might result in greater behavioural and physiological responses.
CONCLUSIONS
P4 pretreatment appears to augment the stress response to social isolation in anoestrous ewes without differences in the behavioural response.
ACKNOWLEDGEMENTS
We would like to thank Florencia Baracochea, Gabriela Magri, Laura Morena, Magdalena Cassarino, Marcela Canabal for their assistance with data collection, and Damián González and Alberto García for their help with animal management.
FUNDING
Financial support was provided by PEDECIBA (Uruguay) and INIA. MJ Hötzel was supported by CNPq, Brazil.
CONFLICT OF INTEREST
The authors have no conflicts of interest to declare.
REFERENCES
1. Barbaccia ML, Serra M, Purdy RH, Biggio G, 2001 Stress and neuroactive steroids. Neurosteroids and Brain Function 46: 243-272.
2. Brunton PJ, McKay AJ, Ochedalski T, et al, 2009 Central opioid inhibition of neuroendocrine stress responses in pregnancy in the rat is induced by the neurosteroid allopregnanolone. J Neurosci 29: 6449-6460.
3. Lambert JJ, Belelli D, Hillvenning C, Peters JA, 1995 Neurosteroids and GABA-A receptor function. Trends Pharmacol Sci 16: 295-303.
4. Bitran D, Shiekh M, McLeod M, 1995 Anxiolytic effect of progesterone is mediated by the neurosteroid allopregnanolone at brain GABA-A receptors. J Neuroendocrinol 7: 171-177.
5. Patchev VK, Hassan AHS, Holsboer F, Almeida OFX, 1996 The neurosteroid tetrahydroprogesterone attenuates the endocrine response to stress and exerts glucocorticoid-like effects on vasopressin gene transcription in the rat hypothalamus. Neuropsychopharmacology 15: 533-540.
6. Freitas-de-Melo A, Banchero G, Hötzel MJ, Damian JP, Ungerfeld R, 2013 Progesterone administration reduces the behavioural and physiological responses of ewes to abrupt weaning of lambs. Animal 7: 1367-1373.
7. Smith SS, Shen H, Gong QH, Zhou X, 2007 Neurosteroid regulation of GABA-A receptors: Focus on the alpha-4 and delta subunits. Pharmacol Ther 116: 58-76.
8. Lofgren M, Johansson I-M, Meyerson B, Lundgren P, Backstrom T, 2006 Progesterone withdrawal effects ‘in the open field test can be predicted by elevated plus maze performance. Horm Behav 50: 208-215.
9. Crossley KJ, Walker DW, Beart PM, Hirst JJ, 2000 Characterisation of GABA-A receptors in fetal, neonatal and adult ovine brain: Region and age related changes and the effects of allopregnanolone. Neuropharmacology 39: 1514-1522.
10. Lynch JJ, Hinch GN, Adams DB 1992 Biological principles and implications for production. In: The behaviour of sheep: Oxon, UK and CSIRO, Victoria, Australia: CAB International.
11. Boissy A, Fisher AD, Bouix J, Hinch GN, Le Neindre P, 2005 Genetics of fear in ruminant livestock. Livest Prod Sci 93: 23-32.
12. Forkman B, Boissy A, Meunier-Salaün M, Canali E, Jones R, 2007 A critical review of fear tests used on cattle, pigs, sheep, poultry and horses. Physiol Behav 92: 340-374.
13. Ferreira A, Carrau A, Rodas E, Rubianes E, Benech A, 1992 Diazepam facilitates acceptance of alien lambs by postparturient ewes. Physiol Behav 51: 1117-1121.
14. Romeyer A, Bouissou MF, 1992 Assessment of fear reactions in domestic sheep, and influence of breed and rearing conditions. Appl Anim Behav Sci 34: 93-119.
15. Parrott RF, Thornton SN, Forsling ML, Delaney CE, 1987 Endocrine and behavioral-factors affecting water-balance in sheep subjected to isolation stress. J Endocrinol 112: 305-310.
16. Pedernera-Romano C, Ruiz de la Torre JL, Badiella L, Manteca X, 2010 Effect of perphenazine enanthate on open-field test behaviour and stress-induced hyperthermia in domestic sheep. Pharmacol Biochem Behav 94: 329-332.
17. Van Lier E, Andersson H, Clariget RP, Forsberg M, 1998 Effects of administration of adrenocorticotrophic hormone ACTH on extragonadal progesterone levels in sheep. Reprod Dom Anim 33: 55-59.
18. Dobson H, Tebble JE, Ozturk M, Smith RF, 1999 Effect of transport on pulsatile lh release in ovariectomized ewes with or without prior steroid exposure at different times of year. J Reprod Fertil 117: 213-222.
19. Bartlewski PM, Beard AP, Rawlings NC, 1999 An ultrasonographic study of luteal function in breeds of sheep with different ovulation rates. Theriogenology 52: 115-130.
20. Bush IE, Ferguson KA, 1953 The secretion of the adrenal cortex in the sheep. J Endocrinol 10: 1-8.
21. Mostl E, Palme R, 2002 Hormones as indicators of stress. Domest Anim Endocrinol 23: 67-74.
22. Takahashi LK, 2001 Role of the CRF1 receptor in fear and anxiety. Neurosci Biobehav Rev 25: 627-636.
23. Chaki S, Ogawa S, Toda Y, Funakoshi T, Okuyama S, 2003 Involvement of the melanocortin MC4 receptor in stress-related behavior in rodents. Eur J Pharmacol 474: 95-101.
24. Benhaj KM, Cooke RG, 1985 Adrenal responses to ACTH in sheep. J Endocrinol 107: 34-34.
25. Villalba JJ, Provenza FD, Shaw R, 2006 Sheep self-medicate when challenged with illness-inducing foods. Anim Behav 71: 1131-1139.
Address for correspondence:
Aline Freitas-de-Melo, Departamento de Biología Molecular y Celular, Facultad de Veterinaria, Universidad de la República, Lasplaces1550, Montevideo 11600, Uruguay;Tel.: +598-26221195; Fax: +598-26221195; E-mail: alinefreitasdemelo@hotmail.com
Received: 02-07-2015, Accepted: 11-09-2015