1Department of Human Pathology, Section of
Clinical Oncology, 2Master Program on Childhood, Adolescent and
Women’s Endocrine Health, 3Department of Biomedical Sciences and of
Morphological and Functional Images, Unit of Nuclear Medicine, 4Department
of Environmental, Health, Social and Industrial Protectionism, 5Department
of Clinical and Experimental Medicine, University of Messina, 6Interdepartmental
Program of Clinical and Molecular Endocrinology & Women’s Endocrine Health,
A.O.U. Policlinico “G. Martino”, Messina, Italy
The first and second authors contributed equally to this work.
Objective: An increased frequency of papillary thyroid carcinoma (PTC) has been reported in the literature, including studies based on fine-needle aspiration cytology (FNAC). Design: To substantiate our own ascertainment of such an increase, we retrieved all the diagnoses of ultrasound-guided FNAC which was performed on 11,389 patients referred for cytological evaluation of a single or dominant thyroid nodule from 1988 to 2010. FNAC yielded 11,258 adequate specimens. Results: The number of patients with PTC was 200 (age 10-83 yrs) and increased significantly from 1988 to 2010 (r= 0.916, P<0.001). Expressing data as percent of FNAC in any given year, PTC and colloid goiter increased, while adenomatous goiter, follicular lesions and anaplastic or medullary thyroid cancer decreased. PTC accounted for 0% of all FNAC diagnoses in 1988 but for 2% in 2010, with a peak of 2.6% in 2006. Of interest, chronic lymphocytic thyroiditis (CLT) also increased, preceding the increase of PTC by 5-6 years. Conclusion: We conclude that in the regions on either side of the Strait of Messina (Italy), PTC has become progressively more frequent during the 23-year period between 1988 and 2010 and that this increase lagged behind the increase of CLT.
Fine-needle aspiration cytology, Papillary thyroid carcinoma, Thyroid cancer
INTRODUCTION
Fine-needle aspiration cytology (FNAC) is the diagnostic modality of choice in the evaluation of thyroid nodules, which in the vast majority of cases are nonneoplastic (benign).1 FNAC is recommended as the initial diagnostic test for such lesions because of its simplicity and reliability. Even though FNAC cannot differentiate between benign and malignant thyroid nodules in 100% of cases, it helps substantially in selecting patients for surgery. Indeed, FNAC has decreased surgical intervention by 25% and has increased the yield of cancer in surgical specimens from 15% to more than 30%.2 With reported sensitivity rates exceeding 90%,1-3 cytological features are particularly accurate in the preoperative detection of papillary thyroid cancer (PTC), which accounts for ≥70% of all thyroid malignancies.4
As described in detail under Discussion, there are several FNAC-based studies reporting the frequency of PTC,5-20 however, with some limitations. None of these studies5-20 addressed the year-to-year change of PTC over a period of time longer than 15 years, particularly in comparison with other thyroid lesions. We therefore sought to assess the yearly change in the FNAC prevalence of PTC and, for comparison, of other lesions over a wide period of time in patients with thyroid nodules. Accordingly, we quantified the annual frequency of PTC and associated demographic indices (genders and age at presentation).
MATERIALS AND METHODS
All patients who come to our Unit are referred for cytological evaluation of their single or dominant thyroid nodule, all of them confirmed as “cold” nodules when thyroid scintigraphy had been performed. The Cytology Unit of our University Hospital is part of the Department of Oncology and ultrasound-guided FNAC (US-FNAC) of thyroid nodules is performed daily. The thyroid is only one of the organs examined in this Unit, with breast, liver and other abdominal organs also being investigated, both in inpatients and outpatients. The overwhelming majority of thyroid FNAC is performed in outpatients, most of who are referred by endocrinologists. All these patients come from North-Eastern Sicily, with a minority coming from Calabria, which is the region across the Strait of Messina.
US-FNAC was and continues to be requested for the diagnostic work-up of thyroid nodules, independently from thyroid volume. Starting from 1988, the team members (sonographist and cytologists) have been the same and cytological diagnoses have been computer-stored. Of 11,389 FNACs performed under US guidance on 11,389 subjects(9,341 women and 2,048 men, F:M ratio= 4.6:1)with a single or dominant thyroid nodule in the 23-year period between January 01, 1998 and December 31, 2010, FNACs were performed in 11,258 persons. FNACs were considered adequate21 when a smear contained at least 6 groups each with 10 or more benign, well-preserved cells. Over the years the cytology team was composed of the same operators and used the same methodology. Cells were aspirated from the single or dominant thyroid nodule by the ultrasonographist (C.S.). The sonographist punctured, with a minimum of 5 passes under continuous real-time US guidance, provided by 7.5 or 10 MHz high frequency transducers. FNAC was performed by standard technique, using a 23-gauge needle attached to a 20-ml disposable syringe mounted on Cameco’s metal syringe holder. No local anesthesia was employed. Alcohol-fixed and air-dried smears were prepared; one or two slides were utilized for rapid staining (a rapid Papanicolaou method) to make an immediate interpretation of the specimen and a cytological pre-diagnosis. The others specimens were stained by the Papanicolaou and the May-Grumwald-Giemsa methods because experience demonstrated a greater efficiency when the two methods are coupled.
For the purposes of the present study we retrieved all FNAC diagnoses obtained in each of the said 23 years, disregarding the inadequate ones (n=131 or 1.15%). Next, we categorized the diagnoses of adequate FNACs into the following groups: colloid goiter (CG), adenomatous goiter (AG), follicular lesions (FL), Hürthle cell tumors (HCT), PTC, anaplastic thyroid cancer (ATC), medullary thyroid cancer (MTC), others. This last group (n= 767) consisted of benign and malignant lesions. Benign lesions (n=740) represented three types of thyroiditis: chronic lymphocytic thyroiditis (CLT), also known as Hashimoto’s thyroiditis (HT, n=700), De Quervain’s thyroiditis (n=38) and Riedel’s thyroiditis (n=2). The identification of DQT and RT, made after FNAC evaluation, was based on the following cytopathologic features: DQT was diagnosed based on the presence of numerous multinucleate histiocytes, few mixed inflammatory cells, abundant epitheliod histiocytes and lymphocytes. Giant cells surrounding and engulfing colloid were particularly characteristic. The giant cells in granulomatous thyroiditis were often very large and could be of either Langhans or foreign-body types. Therefore, in contrast to CLT, follicular center (immature) lymphocytes and Hürthle cells were unusual. We have also seen degenerative changes in follicular cells, residual or scanty colloid, very few macrophages and cellular debris (dirty background). Generally, in RT the findings on FNA are non-specific. The aspirate is poorly cellular, scanty or acellular. It may include a few fibroblasts (fibrosis) and a variable rate of inflammatory cells, such as leukocytes, lymphocytes and histiocytes. However, when the lined (wooden) fibrosis permitted the penetration of the needle, the characteristic finding was the presence of fibroblasts, also in tissue fragments. These two cases of RT were thyroidectomized and diagnoses confirmed at histology.
Other malignant lesions (OML, n=27) included lymphomas (n=2), squamous carcinoma (n=2), soft tissue tumors (n=5), melanoma (n= 1) and metastatic lesions (n=17), particularly from the larynx, lungs, kidneys and breasts.
According to the British Thyroid Association,22 the AACE/AME Task Force on Thyroid Nodules,23 the Italian Consensus Working Group24 and the Bethesda system for Thyroid Cytopathology,21 CG, AG, CLT, DQT and RT are benign lesions, and they are categorized as THY2/TIR 2; FL and HCT are neoplastic/proliferative lesions, and they are categorized as THY3/TIR3; PTC, ATC and MTC are malignant lesions, and they are categorized as THY5/TIR5. Inadequate (or disregarded) FNACs are classified as THY1/TIR1, while FNACs suspicious for malignancy are classified as THY4/TIR4.
Based on our experience with approximately 2,800 cytology and histology paired diagnoses after total/near total thyroidectomy, the following FNAC diagnoses are correct with these rates: 86% (CG), 61% (AG), 98% (PTC), 100% (ATC), 92% (MTC), 92% (CLT); the rate of FL and HTC being malignant (that is, follicular carcinoma or Hürthle cell carcinoma) is 66% and 15%, respectively. In the remaining cases (approximately 8,400), almost all cytological diagnoses were CG, AG and CLT.
Statistical analysis
Continuous variables are expressed as mean ± SD and categorical variables as percentages. Differences between means were assessed by the ANOVA test, while the percentages of categorical variables (cytological diagnoses) based on classes of years were evaluated by the χ2 test. To test for linear trend of change of a given index over time, Pearson’s correlation coefficient was calculated between the index and the 23 calendar years. Regardless of the test, a P value of <0.05 was considered statistically significant, while a P value between 0.05 and 0.10 was considered borderline significant. Statistical analysis was performed using Kyplot v2.0 beta 13 version.
RESULTS
All data are summarized in Tables 1-3 and illustrated in Figures 1-3. As shown in Figure 1, the number of adequate FNACs increased linearly (r= 0.956, P<0.001). The highest increase between two subsequent years occurred between 1998 and 1999 (+75%), the smallest between 2005 and 2006 as well as between 2006 and 2007 (+3% both).
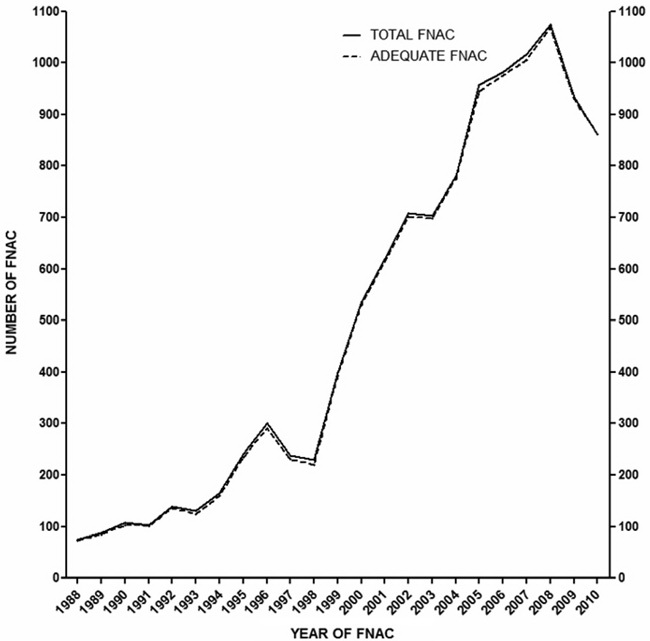
Figure 1. Yearly number of total FNACs (continuous line) and adequate FNACs (discontinuous line) performed at our cytological unit over the study period (1988-2010). The number of total FNACs increased from 75 (year 1988; adequate, n=73) to 1,075 (2008; adequate, n=1,069, a 15-fold change) and decreased in 2009 and 2010. The two curves overlap because there were only 131 inadequate specimens out of a total of 11,389 FNACs (1.2%) performed in 11,389 persons.
Dividing patients into year groups of equal duration, also in order to maximize numbers for scantily represented diagnoses, the chi square test showed, with respect to number of total FNACs, that: the distribution of CG and CLT was significantly increased (P<0.001), the distribution of PTC was borderline increased (P= 0.075), the distribution of HCT and MTC remained unchanged (P= 0.59 and 0.22, respectively), the distribution of AG, FL, ATC, suspicious for malignancy and OML was significantly decreased (P<0.001) (Table 1). On a percent basis, CG and CLT were the only categories that increased significantly over time, at a linear rate (P<0.001) (Table 2). In contrast, PTC increased borderline significantly (P= 0.062) (Table 2), while AG, FL, ATC and OML decreased significantly (Table 2), and MTC decreased nearly significantly (P= 0.080) (Table 2).
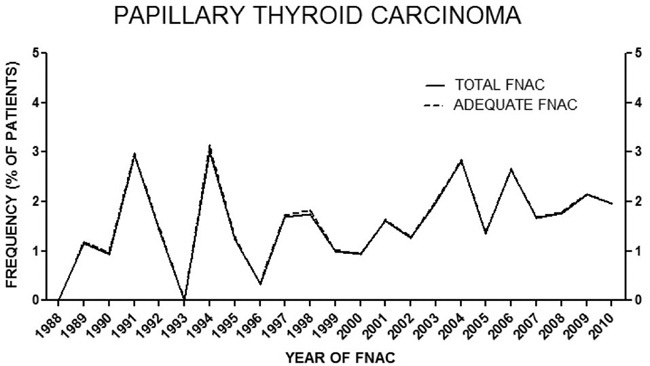
Figure 2. Prevalence of PTC as percentage of all adequate FNACs performed in each year. Prevalence does not change if expressed as % of nodules because the number of patients and number of nodules coincide. The steepest increase was between the years 2000 and 2004 (from n= 5 to n= 22, +4.4-fold, r= 0.933, 95% CI 0.28 to 0.99, P= 0.020; from 0.93% to 2.82%, +3.0-fold, r= 0.903, 95% CI 0.10 to 0.99, P= 0.035).
In Figure 3, all lesions whose number augmented over time are represented on the same scale in terms of fold-increase. From this Figure, one can appreciate comparatively the time it took for any such lesion to increase by a given factor, for instance to double. Differences among lesions are evident in the new millennium, while they start becoming appreciable from the late 90’s. It took 13 years for both PTC and CG to increase by 10-fold (year 2001); thereafter, it took only three years for PTC to double again (22-fold over the initial number), whereas CG did not double yet in the following six years. CLT was the only other lesion that “grew” faster than PTC (see below under the heading “Non PTC lesions”).
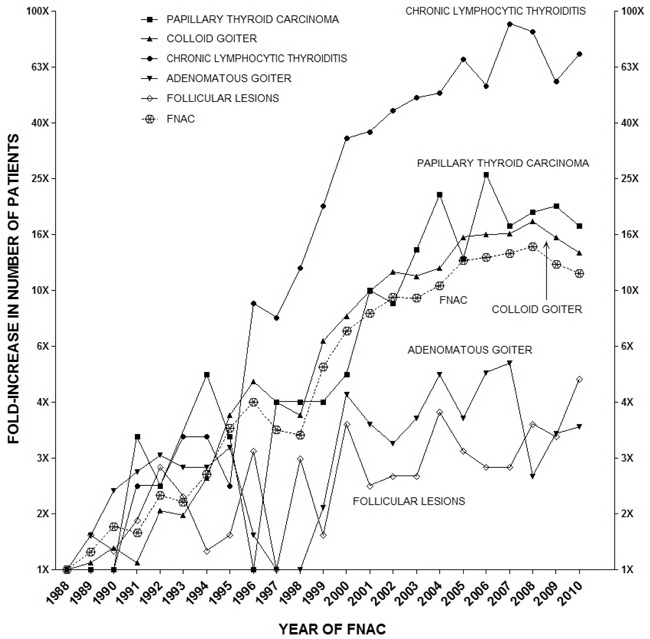
Figure 3. Fold increase in number of patients with the specified cytological diagnosis over the indicated study period (1988-2010). Note the log10 scale on the vertical axes.
PTC
Demographics of the 200 cases of PTC (158 women, 42 men; age 10 to 83 years) are summarized in Table 3. Consistently, men were at least 2 years younger than women, a not statistically significant difference, except in the last 3 years when men were half a year older. Moreover, males were progressively more represented over the 23-yr period.
There were no cases of PTC in 1988, but there were 26 in 2006 and 17 in 2010 (Figure 2). As mentioned above, distribution of PTC as a function of calendar years was trendwise significant in the years 1988-2010 (P= 0.075) (Table 1), but it became significant considering distribution in the four 5-year periods between 1988 and 2007 (χ2= 8.2, P= 0.040). Indeed, the number of PTC doubled in 1993-1997 compared to 1988-1992, and tripled in 1998-2002 compared to 1993-1997 and in 2003-2007 compared to 1998-2002 (Table 1). During 2000-2004, the number of both total FNAC and total adequate FNAC increased by only 1.4-fold (537 to 781, and 530 to 775) and at a significantly linear pace.
Non PTC lesions
Not unexpectedly, CG was the leading lesion, which was at least 39 times more represented than PTC (Table 1), with the lowest number (51) in 1988 and the highest number (901, an 18-fold increase) in 2008. Concerning the 27 malignant lesions categorized as “Others”, there were none in the years 1988, 1993, 1995, 1998, 1999, 2001 and 2004; in each of the remaining years, we observed 1 to 3 such lesions [data not shown].
As shown in Figure 3, CLT was the only lesion that “grew” faster than PTC, starting already in the mid-90’s. It took 6 to 8 years for CLT to increase by 10-fold, and by the year 1999 CLT had doubled again (19-fold increase over the initial value in 1988). One year later, CLT continued to double (35-fold increase over the initial value), and doubled again after another 4 years (66-fold over the initial value). The 2007 value (90-fold increase over the initial value) is double with respect to the value in 2002 (44-fold increase over the initial value). Comparing the CLT curve with the PTC curve, it is evident that PTC lags behind CLT by 5-6 years (Figure 3). In addition, it is striking that both CLT and PTC had two peaks in around the same years. The implication of this parallelism between CLT and PTC is the still controversial issue that CLT might be a precancerous lesion, in that CLT would favor the appearance of PTC.
DISCUSSION
Here we have shown that in the metropolitan, semirural and rural areas served by our cytological unit (North-Eastern Sicily and Southern Calabria), PTC has become progressively more frequent during the 23-year period between 1988 and 2010 with a 9.5-fold average increase in the 18 years between 1990 and 2010. Such an increased frequency of PTC cannot be accounted for by the increased number of FNACs performed over the same 23-year period, the latter increase likely reflecting changes in health care level of access as well as public awareness of the importance of endocrine/thyroid ‘check-up’ and thyroid diseases. The discrepancy is evident in the new millennium (2001-2010), when PTC increased by an average of 3.4-fold over year 2000 but FNAC increased by an average of 1.6-fold.
In the year 1989, the single PTC observed accounted for 1.1% of the 87 FNAC, while the 22 and 26 cases of years 2004 and 2006 accounted for 2.8% of 781 and 2.6% of 982 FNAC, respectively. In particular, in the years 2001-2007 the average increase over year 2000 was 2.1-fold, in contrast to the simultaneous average of 0.6-fold and 0.5-fold decrease for AG and FL, respectively. These opposite directions of changes of PTC vs AG and FL underscore that PTC follows different pathways of oncogenic transformation of the thyroid follicular cell leading to thyroid neoplasia.
As summarized in Table 4,a totalof 16 studies (17 with ours) have evaluated the local epidemiology of thyroid cancer/PTC based on FNAC.5-20 Of these, only ours and another three5,6,13 have cohorts greater than 10,000, whereas nine have cohorts smaller than 1,000.7,8,10,11,15,17-20 Moreover, only 7/16 studies including ours6-8,10,12,13 spanned a period longer than 10 years, but only 2/166,13 and ours reported year-to-year changes. Finally, among the largest studies,5,6,13 only ours covers the years after 2004.
One limitation of FNAC studies with long case series spanning a lengthy period is the changes in the diagnosis of thyroid nodules and their clinical management over time, which are highly dependent upon several variables such as: diagnostic criteria, terminology, management guidelines, adequacy of the sample and also the physical characteristics of the biopsied thyroid lesion and operator experience (i.e. the individual performing the biopsy and interpreting the cytomorphology). In our study, the same cytopathology team assessed all FNAB samples and employed the same technique for the collection and preparation of samples, thus neutralizing or reducing not only inter-observer variability but also the abovementioned limiting variables.25
When these largest studies are considered,5,6,13 our rate of malignancy of 2.3% (Table 4, footnote) matches the 2.4% rate of the other Italian cohort,5 is similar to the 3.4% of the Taiwanese cohort13 but is somewhat lower than the 5.6% of the Dutch cohort6. Two-digit rates are almost invariably reported in cohorts smaller than 1,000 cases (Table 4), with the remarkable exception of the 2.3% rate observed in Greece,8 a Southern European country like Italy.
CLT was the only lesion that showed the highest fold increase of percentage change from 1988 to 2010 based on total FNAC. These data agree with a number of studies reported in the literature, particularly with the studies methodologically closer to ours.26-28 Because the annual increase of CLT preceded the annual increase of PTC with an overall parallelism between the two curves (Figure 3), and because both CLT and PTC displayed a similar decrease of F:M ratio over the years (this study and Ref. 27), there are grounds to believe that environmental changes may have favored both thyroid autoimmune disease and PTC-oriented thyroid oncogenesis. However, thyroid autoimmunity responded to such environmental changes more quickly than thyroid oncogenesis, thus explaining why the increased frequency of CLT preceded the increased frequency of PTC.
An association has been controversially suggested between CLT and PTC. Fiore et al29 showed that the frequency of PTC in nodular-CLT patients was significantly higher compared with patients with non-CLT nodular goiter and was strongly correlated with TSH levels. These authors29 hypothesized that higher TSH levels increase the probability that mutated oncogenes30 may cause clinically detectable cancer. Moreover, rearrangements of RET oncogene (RET/PTC), which are frequently detected in PTC, may also be found in the thyroids of patients affected by CLT, with no histopathological evidence of PTC.31
There are numerous environmental factors that may favor the development of thyroid nodules (including PTC) and their trends over time. Such factors include: low iodine as well as goitrogenic or non-goitrogenic natural substances contained in various foods (e.g. chlorate, thiocyanate, nitrates, isoflavones);32,33 heavy metals and polluting chemicals that are increasingly known to affect thyroidal growth and homeostasis (e.g. polychlorinated biphenyls, phthalates, bisphenol A and other plasticizers). Compared to other areas mentioned in Table 4, in which some or all these factors could play an important role in PTC incidence, we think that another environmental factor is the presence of the Etna volcano in Eastern Sicily, precisely in the province of Catania which is just south of our province. This volcano hosts a major aquifer that provides drinking water and irrigation to large agricultural areas nearby. Various chemicals (including HCO3, SO4, calcium, fluoride, chloride, magnesium, boron, manganese, iron, vanadium and also 222Radon) were found increased in water samples from various sources of this volcanic aquifer.34 Finally, active volcanoes like Etna produce suspended particulate matter and gases that may contaminate the environment. However, investigation into the nature of these triggering environmental factors was not the goal of our present work.
The authors have no conflict of interest to declare.
REFERENCES
1. Caruso D, Mazzaferri EL, 1991 Fine needle aspiration biopsy in the management of thyroid nodules. Endocrinologist 1: 194-202.
2. Gharib H, Goellner JR, Johnson DA, 1993 Fine-needle aspiration cytology of the thyroid: a 12-year experience with 11,000 biopsies. Clin Lab Med 13: 699-709.
3. Gharib H, Goellner JR, 1993 Fine-needle aspiration biopsy of the thyroid: an appraisal. Ann Intern Med 118: 282-289.
4. Mittendorf EA, McHenry CR 2004 Thyroid cancer. In: Cameron JL, ed. Current Surgical Therapy. 8th ed. Philadelphia, Pa: Elsevier Mosby; pp, 584-591.
5. Rago T, Fiore E, Scutari M, et al, 2010 Male sex, single nodularity, and young age are associated with the risk of finding a papillary thyroid cancer on fine-needle aspiration cytology in a large series of patients with nodular thyroid disease. Eur J Endocrinol 162: 763-770.
6. Netea-Maier RT, Aben KK, Casparie MK, et al, 2008 Trends in incidence and mortality of thyroid carcinoma in The Netherlands between 1989 and 2003: correlation with thyroid fine-needle aspiration cytology and thyroid surgery. Int J Cancer 123: 1681-1684.
7. Martínek A, Dvorácková J, Honka M, Horácek J, Klvana P, 2004 Importance of guided fine needle aspiration cytology (FNAC) for the diagnostics of thyroid nodules - own experience. Biomed Pap Med Fac Univ Palacky Olomouc Czech Repub 148: 45-50.
8. Zagorianakou P, Malamou-Mitsi V, Zagorianakou N, et al, 2005 The role of fine-needle aspiration biopsy in the management of patients with thyroid nodules. In Vivo 19: 605-609.
9. Frates MC, Benson CB, Doubilet PM, et al, 2006 Prevalence and distribution of carcinoma in patients with solitary and multiple thyroid nodules on sonography. J Clin Endocrinol Metab 91: 3411-3417.
10. Charles MA, Heller KS, 1997 Cytologic determinants of well-differentiated thyroid cancer. Am J Surg 174: 545-547.
11. Lew JI, Snyder RA, Sanchez YM, Solorzano CC, 2011 Fine needle aspiration of the thyroid: correlation with final histopathology in a surgical series of 797 patients. J Am Coll Surg 213: 188-194.
12. Burgess JR, Tucker P, 2006 Incidence trends for papillary thyroid carcinoma and their correlation with thyroid surgery and thyroid fine-needle aspirate cytology. Thyroid 16: 47-53.
13. Lin JD, Chao TC, Huang BY, et al, 2005 Thyroid cancer in the thyroid nodules evaluated by ultrasonography and fine-needle aspiration cytology. Thyroid 15: 708-717.
14. Ko HM, Jhu IK, Yang SH, et al, 2003 Clinicopathologic analysis of fine needle aspiration cytology of the thyroid. A review of 1,613 cases and correlation with histopathologic diagnoses. Acta Cytol 47: 727-732.
15. Nam-Goong IS, Kim HY, Gong G, et al, 2004 Ultrasonography-guided fine-needle aspiration of thyroid incidentaloma: correlation with pathological findings. Clin Endocrinol (Oxf) 60: 21-28.
16. Choi YJ, Kim SM, Choi SI, 2008 Diagnostic accuracy of ultrasound features in thyroid microcarcinomas. Endocr J 55: 931-938.
17. Choi YJ, Park YL, Koh JH, 2008 Prevalence of thyroid cancer at a medical screening center: pathological features of screen-detected thyroid carcinomas. Yonsei Med J 49: 748-756.
18. Cheung YS, Poon CM, Mak SM, Suen MW, Leong HT, 2007 Fine-needle aspiration cytology of thyroid nodules--how well are we doing? Hong Kong Med J 13: 12-15.
19. Al-Hureibi KA, Al-Hureibi AA, Abdulmughni YA, et al, 2003 The diagnostic value of fine needle aspiration cytology in thyroid swellings in a university hospital, Yemen. Saudi Med J 24: 499-503.
20. El Hag IA, Kollur SM, Chiedozi LC, 2003 The role of FNA in the initial management of thyroid lesions: 7-year experience in a district general hospital. Cytopathology 14: 126-130.
21. Ali SZ, Cibas ES 2010 The Bethesda System for Reporting Thyroid Cytopathology: Definitions, Criteria, and Explanatory Notes. Ali SZ, Cibas ES (eds), Springer, New York.
22. British Thyroid Association. Guidelines for the management of thyroid cancer in adults. London: Royal College of Physicians of London and the British Thyroid Association, 2002. Available from URL: http://www.british-thyroid-association.org/
23. Gharib H, Papini E, Valcavi R, et al; AACE/AME Task Force on Thyroid Nodules, 2006 American Association of Clinical Endocrinologists and Associazione Medici Endocrinologi medical guidelines for clinical practice for the diagnosis and management of thyroid nodules. Endocr Pract 12: 63-102.
24. Fadda G, Basolo F, Bondi A, et al; SIAPEC-IAP Italian Consensus Working Group, 2010 Cytological classification of thyroid nodules. Proposal of the SIAPEC-IAP Italian Consensus Working Group. Pathologica 102: 405-408.
25. Baloch ZW, Bedrossian C, 2012 Following the steps of Abu al-Qasim to Bethesda and beyond: the continuing deliberations in thyroid fine-needle aspiration. Diagn Cytopathol 40 Suppl 1: E1-3.
26. Slowinska-Klencka D, Sporny S, Klencki M, Popowicz B, Lewisnski A, 2006 Chronic thyroiditis- current issue in the cytological diagnostics of the thyroid gland. Endokrynol Pol 57: 299-306.
27. Rizzo M, Rossi RT, Bonaffini O, et al, 2010 Increased annual frequency of Hashimoto’s thyroiditis between years 1988 and 2007 at a cytological unit of Sicily. Ann Endocrinol (Paris) 71: 525-534.
28. Koch CA, Sarlis NJ, 2001 The spectrum of thyroid diseases in childhood and adulthood: natural history, diagnosis, differential diagnosis, and management. J Endocrinol Invest 24: 659-675.
29. Fiore E, Rago T, Latrofa F, et al, 2011 Hashimoto’s thyroiditis is associated with papillary thyroid carcinoma: role of TSH and of treatment with L-thyroxine. Endocr Relat Cancer 18: 429-437.
30. Sarlis NJ, Benvenga S 2004 Molecular signaling in thyroid cancer. In: Molecular basis of thyroid cancer. Farid NR (ed). Kluwer Academic Publishers, Boston; pp, 237-264.
31. Asa SL 2004 The pathology of thyroid cancer. In: Molecular basis of thyroid cancer. Farid NR (ed). Kluwer Academic Publishers, Boston; pp, 23-67.
32. Diamanti-Kandarakis E, Bourguignon JP, Giudice LC, et al, 2009 Endocrine-disrupting chemicals: an Endocrine Society scientific statement. Endocr Rev 30: 293-342.
33. Zoeller RT, Brown TR, Doan LL, et al, 2012 Endocrine-disrupting chemicals and public health protection: a statement of principles from The Endocrine Society. Endocrinology 153: 4097-4110.
34. Pellegriti G, De Vathaire F, Scollo C, et al, 2009 Papillary thyroid cancer incidence in the volcanic area of Sicily. J Natl Cancer Inst; 101: 1575-1583.
Address for correspondence:
Alessandro Sindoni, MD, Dipartimento di Scienze Biomediche e delle
Immagini Morfologiche e Funzionali, U.O.C. di Medicina
Nucleare, A.O.U. Policlinico “G. Martino”, Via Consolare Valeria 98125 Messina,
Italy, Tel.: +39 090 2212838; Fax: +39 090 2212843;
e-mail: alessandrosindoni@alice.it
Received 23-08-12, Accepted 03-12-1