1Department of Medical
Sciences, University of Milan, Endocrinology and Diabetology Unit, Fondazione
IRCCS Cà Granda Policlinico, Milan, Italy; 1,2Unit of Endocrinology,
Istituto Clinico Humanitas IRCCS, Rozzano, Milan, Italy
*The two authors contributed equally to the study
OBJECTIVE: The diagnosis of hypothalamic-pituitary-adrenal insufficiency (HPAI) is a major clinical challenge. The gold standard procedure remains insulin tolerance test (ITT). This study aimed to evaluate the usefulness of standard-dose corticotrophin stimulation test (SDCT) in diagnosing HPAI. DESIGN: In this prospective study we performed SDCT and ITT in 55 consecutive patients (37F/18M) affected by pituitary disorders. RESULTS: A normal response to ITT was found in 44 patients, while HPAI was diagnosed in 11. Using ITT as reference test, the ROC curve showed that a cortisol value of 18 µg/dl (500 nmol/L) at 30 min or 21.8 µg/dl (600 nmol/L) at 60 min after SDCT represents the best compromise between sensitivity and specificity in diagnosing HPAI. Moreover, 30 min cortisol values >20.3 µg/dl (560 nmol/L) or 60 min cortisol values >24.1 µg/dl (665 nmol/L) exclude HPAI. Four out of 15 patients of Group A, previously non-respondent to SDCT, showed a normal response to a second SDCT. CONCLUSIONS: SDCT is not a reliable tool to identify HPAI, but it appears to be more useful in confirming the normality of HPA function. When SDCT fails to exclude HPAI, ITT should be performed. If ITT is contraindicated, retesting patients by SDCT is useful before starting an unnecessary replacement therapy.
Central hypoadrenalism, HPAI, ITT, SDCT
INTRODUCTION
Central
hypoadrenalism occurs in about one third of patients with
hypothalamic-pituitary disorders,1 and its diagnosis is necessary to
allow a prompt replacement therapy in a potentially life-threatening condition.
The insulin tolerance test (ITT) remains the gold standard procedure for the
diagnosis of hypothalamic-pituitary-adrenal insufficiency (HPAI) where a
cortisol peak greater than 18 µg/dl (500 nmol/L) is generally accepted to
define a normal response.2-6 However, ITT is potentially hazardous,
requires strict monitoring of the patients and is contraindicated in subjects
with ischemic heart disease, arrhythmias or history of epilepsy.
In
recent years different provocative tests, in particular the standard-dose (250
µg) corticotrophin stimulation test (SDCT) and low-dose (1 µg) corticotrophin
stimulation test (LDCT), have been developed in order to provide a safe and
effective alternative to ITT in the diagnosis of central hypoadrenalism. To
date, a cortisol cut-off value from 18 to 23.5 µg/dl (500 to 650 nmol/L) at 30
min or 60 min after SDCT and from 18 to 21.7 µg/dl (500 to 599 nmol/L) at 30
min or peak levels after LDCT have been proposed to define a normal response.2-4,7-16
The diagnostic accuracy of SDCT at 30 min and 60 min cortisol values is
considered similar.1 Finally, data concerning the comparison between
SDCT and LDCT are discordant, though LDCT seems to provide better sensitivity
in diagnosing cortisol deficiency.1
In
a recent meta-analysis, Kazlauskaite and colleagues analyzed results of 13
studies with at least ten subjects (total number of patients: 679) with
suspected HPAI who underwent a reference test (ITT or metyrapone test),
proposing a three-step approach for the assessment of HPA axis function.1
In this approach, patients with basal cortisol levels (step 1) below 5 µg/dl
(138 nmol/L) or 30 min cortisol levels after SDCT (step 2) below 16 µg/dl (440
nmol/L) are mostly affected by HPAI. Conversely, patients with basal cortisol
levels above 13 µg/dl (471 nmol/L) or 30 min cortisol levels after SDCT above
30 µg/dl (833 nmol/L) can be considered normal. Intermediate values of basal
cortisol (5-13 µg/dl, 138-471 nmol/L) and then 30 min cortisol levels after
SDCT (16-30 µg/dl, 440-833 nmol/L) require ITT (step 3).
In
the last few years, concerns about the risk of unnecessary chronic
glucocorticoid therapy in patients with pituitary disorders have been
expressed, with regard to the difficulties in assessing a replacement therapy
mimicking the circadian rhythm of cortisol secretion.17
The
aim of this study was to verify the diagnostic performance of SDCT in a cohort
of patients referred to our center for hypothalamic-pituitary disorders by
considering ITT as gold standard procedure for HPAI diagnosis.
MATERIALS AND METHODS
Patients
The
study included 55 patients affected by different hypothalamic-pituitary
disorders (37F and 18M, mean age at diagnosis: 40.5±10.6 yrs). Specifically, 19
patients had nonfunctioning pituitary adenomas (10 macroadenomas and 9
microadenomas, 7 of whom treated by transsphenoidal surgery, followed by
radiotherapy in 2), 14 prolactinomas (7 macroadenomas and 7 microadenomas, 2 of
whom had transsphenoidal surgery), 7 empty sella, 5 GH-secreting pituitary
adenomas (4 macroadenomas and 1 microadenoma treated by transsphenoidal surgery
followed by radiotherapy in 2), 3 lymphocytic hypophysitis, 2 Rathke's cleft
cysts (1 treated by transsphenoidal surgery), 2 idiopathic hypopituitarism, 1
granulomatosis, 1 TSH-secreting macroadenoma and 1 ACTH-secreting microadenoma
(both studied after a successful transsphenoidal surgery). At the beginning of
the study, 13 patients had hypopituitarism (single deficit in 5 patients and
multiple deficit in 8 patients). In detail, 10 patients showed GH deficiency, 8
patients hypogonadism, 3 patients diabetes insipidus and 2 patients
hypothyroidism. All patients were evaluated at least two months after
neurosurgery, were receiving appropriate replacement therapy for pituitary
deficits and all nine patients receiving cortisol substitution stopped the
treatment 24 h prior to the tests. In particular, the doses of cortisone
acetate were stable between SDCT and ITT and no patient started replacement
therapy between SDCT and ITT. Two female patients receiving estrogen
replacement were tested after at least one month of treatment interruption.
Patients taking steroids for unrelated diseases were excluded.
The
Local Ethical Committee approved the study protocol and all patients gave their
informed written consent to participate in the study.
Study protocol
All
patients were evaluated in a fasting state at 08.00 h with an iv catheter
inserted in a forearm vein and kept patent by slow saline infusion. In all
cases, a SDCT followed by an ITT were performed, with a maximum interval of 6
weeks between tests (range: 2-6). In a subgroup of 15 patients, SDCT was
repeated after a mean period of 6 months (range: 4-9). ACTH levels were assayed
at baseline.
For
the SDCT, 250 µg of tetracosactide (Synacthen 0.25 mg/1ml, Biofutura Pharma,
Pomezia, Italy) was injected as a bolus intravenously. Blood samples for
cortisol evaluation were taken at 0, 30 and 60 min. The choice of SDCT was made
in order to avoid the possible inaccuracy in the dilution of the 250 µg vials,
which is required for LDCT.
For
the ITT, iv insulin bolus (Actrapid, Novo Nordisk, Denmark) at 0.1 U/kg body
weight was administered. Blood samples for cortisol evaluation were taken at 0,
30, 45, 60, 90 and 120 minutes. Hypoglycaemia was considered adequate in the
presence of blood glucose levels of less than 40 mg/dl (2.2 mmol/l). A peak
cortisol level greater than 18 µg/dl (500 nmol/l) was considered normal.
Assays
All
hormone measurements were performed in the same laboratory. Plasma ACTH levels
(pg/ml) were measured by chemoluminescent immunometric assay (Immulite 2000,
Siemens Medical Solutions Diagnostics, Los Angeles, CA, USA) with an
inter-assay coefficient of variation ranging from 6.1 to 10.0%, an intra-assay
coefficient of variation ranging from 6.7 and 9.5% and sensitivity of 5 pg/ml.
Serum
cortisol levels (µg/dl) were measured by electrochemiluminescence immunoassay
(ECLIA) (Roche Cobas Cortisol, Roche Diagnostics, Mannheim, Germany) with an
inter-assay coefficient of variation ranging from 1.4 to 1.6%, an intra-assay
coefficient of variation ranging from 1.0 and 1.4% and lower detection limit of
0.018 µg/dl. Glucose was measured using the standard method.
Statistical
analysis
Statistical
analysis was performed using the Statistical Package for the Social Sciences,
version 12.0 (SPSS Inc, Chicago, IL, USA). All results are expressed as mean ±
SD unless otherwise stated. A Student's t-test was performed to compare
continuous variables among groups when data were normally distributed.
Categorical variables were compared by Fisher or χ2
test, where appropriate. Linear regression analysis was used to determine
correlation coefficients between different parameters.
The
receiver operating characteristic (ROC) curve was obtained, using ITT as
reference test, to assess the sensitivity and specificity of the SDCT in the
diagnosis of HPAI at different cut-off values both for 30 and 60 min serum
cortisol levels during the test. The area under the ROC curve (AUC) and
pairwise comparison of ROC curves for 30 and 60 min serum cortisol levels was
also calculated. Positive (PPV), negative (NPV) predictive value, sensitivity,
specificity and accuracy were calculated using the number of patients
true-positive (TP), true-negative (TN), false-positive (FP) and false-negative
(FN). PPV (calculated as TP/(TP+FP) was defined as the likelihood that a
subject with a positive test (peak cortisol below the specific cut-off point)
is affected with central hypoadrenalism. NPV (calculated as TN/(TN+FN) was
defined as the likelihood that a subject with a negative test (peak cortisol
above the specific cut-off point) has a normal HPA function.
Values
of P<0.05 were considered statistically significant.
To
assess reliability between stimulation tests, a limits of agreement plot as
proposed by Bland and Altman was used (MedCalc Software Version 12.2.1). Limits
of agreement between cortisol peak after SDCT and ITT were determined using 95%
sample confidence intervals.
RESULTS
Of
the 55 patients, 44 patients showed a normal response to ITT [peak cortisol
levels greater than 18 µg/dl (500 nmol/L), Group A]. In the remaining 11
patients diagnosis of adrenal insufficiency was made (peak cortisol levels
below 18 µg/dl, Group B).
Clinical
and biochemical characteristics of the patients divided into Group A and Group
B are shown in Table 1. Age, basal cortisol, ACTH levels and prevalence of
other pituitary deficits were comparable between groups. Conversely, cortisol
levels obtained via SDCT at 30 and 60 min were significantly lower in patients
belonging to Group B with respect to Group A.
Analyzing
SDCT data with the ROC curve, a cortisol value of 18 µg/dl (500 nmol/L) at 30
min pairs the highest sensitivity (64%) and specificity (64%), correctly
identifying hypoadrenalism (30 min cortisol levels below 18 µg/dl) only in 30%
of patients with positive tests (PPV) and correctly identifying normal HPA axis
function (30 min cortisol levels above 18 µg/dl) in 88% of patients with
negative tests (NPV) (accuracy 64%) (Figure 1A). Similarly, considering
cortisol levels at 60 min, the ROC curve showed that the SDCT with a cut-off
value of 21.8 µg/dl (600 nmol/L) achieved a sensitivity of 72% and a
specificity of 61%, with a PPV of 32%, a NPV of 90% and accuracy of 64% (Figure
1B). The AUC values for cortisol levels at 30 and 60 min were comparable (0.690
vs 0.707, P=0.8).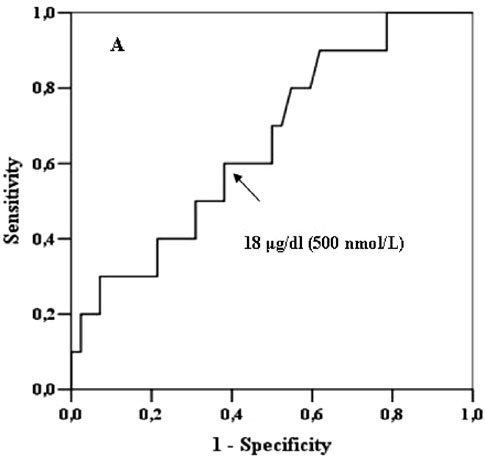
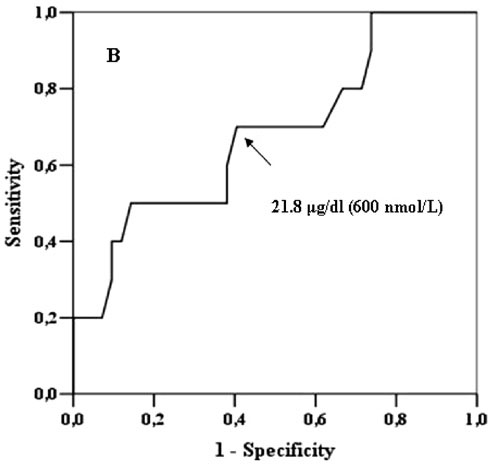
Figure 1. ROC curves for SDCT in the diagnosis of HPA insufficiency. A) ROC curve for 30-min cortisol levels at SDCT in identifying patients with an insufficient cortisol response after ITT. The arrow points at the 18 μg/dl (500 nmol/L) cut-off which is the cut-off with the best compromise between sensitivity and specificity. B) ROC curve for 60-min cortisol levels at SDCT in identifying patients with an insufficient cortisol response after ITT. The arrow points at the 21.8 μg/dl (600 nmol/L) cut-off which is the cut-off with the best compromise between sensitivity and specificity.
Among
patients of Group B, no patient showed cortisol levels higher than 20.3 µg/dl
(560 nmol/L) and 24.1 µg/dl (665 nmol/L) at 30 and 60 min after SDCT,
respectively (Figure 2). Therefore, the cut-off of 20.3 µg/dl at 30 min showed
a 100% sensitivity and a 21% specificity, enabling identification of all
patients with adrenal insufficiency but with a high rate of false positive
results (PPV 24%, NPV 100%, accuracy 36%, Figure 2A). Similar data were
obtained with the cortisol value of 24.1 µg/dl at 60 min (PPV 25%, NPV 100%,
accuracy 40%, Figure 2B). 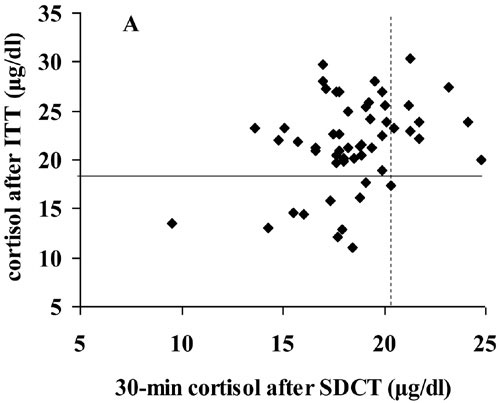
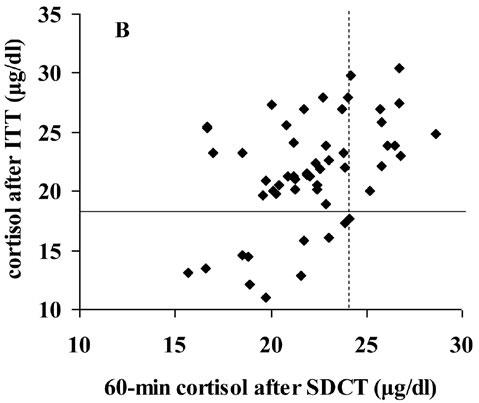
Figure 2. Comparison between cortisol response to SDCT and ITT. A) Peak serum cortisol response to ITT vs 30-minutes serum cortisol response to SDCT. Continuous line represents cut-off limit for the diagnosis of hypoadrenalism after ITT (18 μg/dl, 500 nmol/L). Broken line represents cut-off with 100% sensitivity for the diagnosis of hypoadrenalism after SDCT (20.3 μg/dl, 560 nmol/L). B) Peak serum cortisol response to ITT vs 60-minutes serum cortisol response to SDCT. Continuous line represents cut-off limit for the diagnosis of hypoadrenalism after ITT (18 μg/dl, 500 nmol/L). Broken line represents cut-off with 100% sensitivity for the diagnosis of hypoadrenalism after SDCT (24.1 μg/dl, 665 nmol/L).
Also
considering a cut-off of 16 µg/dl (440 nmol/L), as proposed by Kazlauskaite and
colleagues,1 SDCT correctly identified hypoadrenalism (30 min
cortisol levels below 16 µg/dl) in only 43% of patients with positive tests
(PPV), while correctly it identified normal HPA axis function (30 min cortisol
levels above 16 µg/dl) in 83% of patients with negative tests (NPV), showing a
sensitivity of 27% and specificity of 91%. As a whole, SDCT with a cut-off of
16 µg/dl failed to correctly detect 12 out of 55 patients (accuracy 78%). The
performance of SDCT with these different cut-offs is summarised in Table 2.
The
Bland-Altman difference plot showed a bias of 0.6 (-0.47 to 1.66)%
(mean [95% confidence interval]) with 95% limits of agreement -7.1 to 8.3, and
no systematic bias was evident (not shown). Moreover, a statistically
significant correlation was found between cortisol peak after SDCT and ITT (r2=
0.51, p<0.001).
With
regard to basal cortisol levels, no patient with diagnosis of HPAI by ITT
showed levels higher than 11.4 µg/dl (315 nmol/L). Conversely, four out of six
patients with basal cortisol levels lower than 5 µg/dl (138 nmol/L) showed a
normal response after ITT.
Finally,
in 15 patients of Group A, previously non-respondent to SDCT, a second SDCT was
performed after a mean period of 6 months. In 4 out of these 15 patients, 30
min cortisol levels >20.3 µg/dl (560 nmol/L) or 60 min cortisol levels
>24.1 µg/dl (665 nmol/L) were found, thus confirming the as per ITT normal
HPA function (Figure 3).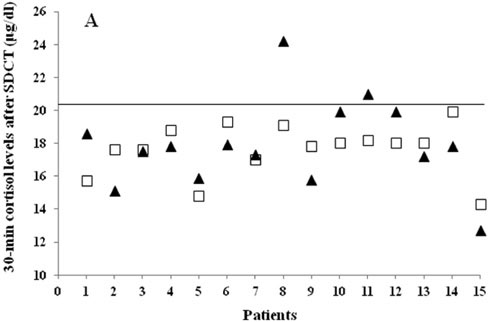
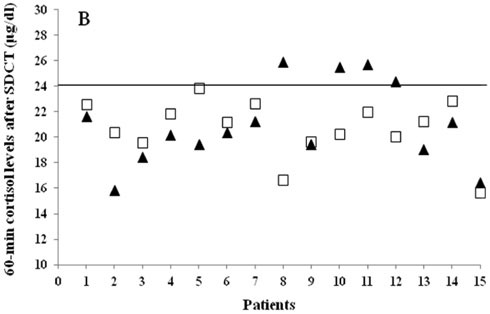
Figure 3. Modification of cortisol response to SDCT over time in a subgroup of 15 patients. A) 30-min serum cortisol levels after first (grey squares) and repeated SDCT (black triangles). Continuous line represents cut-off with 100% sensitivity for the diagnosis of hypoadrenalism after SDCT (20.3 μg/dl, 560 nmol/L). B) 60-min cortisol levels after first (grey squares) and repeated SDCT (black triangles). Continuous line represents cut-off with 100% sensitivity for the diagnosis of hypoadrenalism after SDCT (24.1 μg/dl, 665 nmol/L).
DISCUSSION
Central
adrenal deficiency in patients with pituitary disorders is a life-threatening
condition and requires a chronic replacement therapy. However, the diagnosis of
this condition is still controversial. Among the different tests proposed, ITT
is considered the gold standard and a cortisol peak greater than 18 µg/dl (500
nmol/L) is widely accepted as defining a normal response, though some authors
have reported a poor reproducibility of cortisol response to ITT in subjects
with hypopituitarism,18 as well as some cases of misclassification
in patients with clinically manifest hypoadrenalism.19
In
recent years different provocative tests, in particular the standard-dose (250
µg) corticotrophin stimulation test (SDCT) and low-dose (1 µg) corticotrophin
stimulation test (LDCT), have been developed in order to provide a safe and
effective alternative to ITT in the diagnosis of central hypoadrenalism.
However, the diagnostic performance of these tests depends on the value of
cortisol cut-off, which as yet remains uncertain.
In
the present study, considering ITT as a reference test, ROC analysis showed
that cortisol levels of 18 µg/dl (500 nmol/L) at 30 min and 21.8 µg/dl (600
nmol/L) at 60 min after SDCT reached the best compromise between sensitivity
and specificity, although they correctly identified hypoadrenalism only in 30%
of patients with positive tests. Therefore, in our patients the accuracy of
SDCT in diagnosis of central hypoadrenalism was poor. The diagnostic
discrimination of 30 and 60 min cortisol levels was similar, according to data
of previous studies.1 Furthermore, although 30 min cortisol levels
after SDCT appear to be sufficient to evaluate the HPA axis, different thresholds
should be considered when 60 min cortisol levels after SDCT are used.20
A
recent revision of the available studies suggested that a 30 min. cortisol
response to SDCT lower than 16 µg/dl (440 nmol/L) or higher than 30 µg/dl (833
nmol/L) strongly supports or excludes diagnosis of HPAI, respectively, while
intermediate values are diagnostically inconclusive and require additional
assessment with ITT.1 Considering these cut-off values for SDCT, we
would have diagnosed ACTH insufficiency in 7 out of 55 patients, while the
other 48 subjects would have shown intermediate values of 30 min cortisol
(16-30 µg/dl). Therefore, according to these criteria for SDCT, no patient of
the present cohort would have received a diagnosis of normal HPA function. This
is in strong contrast with the results obtained by retesting the patients with
ITT, since a normal cortisol response to ITT was achieved in 44 patients and
notably in 4 out of 7 patients with a peak cortisol level after SDCT below 16
µg/dl. Moreover, although the choice of a 30 min cut-off as low as that
proposed by Kazlauskaite and colleagues permits achievement of the highest
accuracy (78%), it leads to an incorrect diagnosis of central hypoadrenalism in
the majority of patients analysed, which fail SDCT but show a normal response
after ITT.
In
our cohort of patients 30 min cortisol levels higher than 20.3 µg/dl (560
nmol/L) or 60 min cortisol levels higher than 24.1 µg/dl (665 nmol/L), we were
able to exclude the presence of HPAI with a sensitivity of 100%. Although
obtained in a limited number of patients, these results are in agreement with
those of other authors, suggesting that these cut-offs allow reasonable
exclusion of the disease.9,11,21 Obviously the choice of these
cut-offs dramatically decreases the specificity (21% and 25%, respectively) of
SDCT, correctly identifying only a quarter of subjects with normal HPAI
function.
Moreover,
4 out of 15 patients (27%) with a normal response to ITT but indeterminate
cortisol levels after SDCT (30 min cortisol levels lower than 20.3 µg/dl or 60
min cortisol levels lower than 24.1 µg/dl) showed a normal HPA function when
retested by SDCT after a short period.
This
finding may be of clinical relevance in the presence of any contraindication to
ITT or for those Centers poorly experienced with this procedure. In these
cases, the repetition of SDCT over time should be considered before initiation
of a chronic replacement therapy.
As
reported for the performance of SDCT, in the present study the importance of
basal cortisol levels in HPAI diagnosis was limited, since 4 out of 6 patients
showing basal cortisol levels lower than 5 µg/dl (138 nmol/L) had a normal
response to ITT. Conversely, basal cortisol levels greater than 11.4 µg/dl (315
nmol/L) seemed to suggest a normal HPA axis function.
It
must be stressed that the aim of this study was to evaluate the diagnostic
performance of the SDCT in the diagnosis of central hypoadrenalism in a limited
cohort of patients with pituitary disease referred to our center and not to
define new cut-offs for basal or after SDCT cortisol values. Indeed, in
addition to the limitation due to the low number of patients of the present
series, it is well known that cortisol measurement suffers from assay
variability, leading to different cut-off values and diagnostic parameters.22
Moreover, the cut-off of 18 µg/dl (500 nmol/L) used to define a normal response
to ITT, based on cortisol response to surgical stress,23 should be
confirmed in each Endocrine Unit with modern assay methods.
In
conclusion, we observed that despite the choice of a strict cut-off value as 16
µg/dl, SDCT did not allow correct identification of patients with HPAI, leading
to an overestimation of the frequency of HPAI. Nevertheless, according to the
present data we suggest that SDCT, together with basal cortisol levels, may
represent a valid procedure for patients with suspected central hypoadrenalism,
with the main aim of excluding ACTH deficiency. When SDCT fails to rule out
HPAI, ITT should be performed. If ITT is contraindicated, retesting patients by
SDCT at 6-month intervals is useful in order to avoid unnecessary cortisol
replacement therapy.
Funding
This
work was partially supported by AIRC (grant number MFAG 8972).
REFERENCES
1. Kazlauskaite R, Evans AT, Villabona CV, et al, 2008 Consortium for Evaluation of Corticotropin Test in Hypothalamic-Pituitary Adrenal Insufficiency. Corticotropin tests for hypothalamic-pituitary-adrenal insufficiency: a metaanalysis. J Clin Endocrinol Metab 93: 4245-4253.
2. Abdu TA, Elhadd TA, Neary R, Clayton RN, 1999 Comparison of the low dose short synacthen test (1 microg), the conventional dose short synacthen test (250microg), and the insulin tolerance test for assessment of the hypothalamo-pituitary-adrenal axis in patients with pituitary disease. J Clin Endocrinol Metab 84: 838-843.
3. Tordjman K, Jaffe A, Trostanetsky Y, Greenman Y, Limor R, Stern N, 2000 Low-dose (1 microgram) adrenocorticotrophin (ACTH) stimulation as a screening test for impaired hypothalamo-pituitary-adrenal axis function: sensitivity, specificity and accuracy in comparison with the high-dose (250 microgram) test. Clin Endocrinol (Oxf) 52: 633-640.
4. Giordano R, Picu A, Bonelli L, et al, 2008 Hypothalamus-pituitary-adrenal axis evaluation in patients with hypothalamo-pituitary disorders: comparison of different provocative tests. Clin Endocrinol (Oxf) 68: 935-941.
5. Finucane FM, Liew A, Thornton E, Rogers B, Tormey W, Agha A, 2008 Clinical insights into the safety and utility of the insulin tolerance test (ITT) in the assessment of the hypothalamo-pituitary-adrenal axis. Clin Endocrinol (Oxf) 69: 603-607.
6. Berg C, Meinel T, Lahner H, Yuece A, Mann K, Petersenn S, 2010 Diagnostic utility of the glucagon stimulation test in comparison to the insulin tolerance test in patients following pituitary surgery. Eur J Endocrinol 162: 477-482.
7. Dökmetaş HS, Colak R, Keleştimur F, Selçuklu A, Unlühizarci K, Bayram F, 2000 A comparison between the 1-microg adrenocorticotropin (ACTH) test, the short ACTH (250 microg) test, and the insulin tolerance test in the assessment of hypothalamo-pituitary-adrenal axis immediately after pituitary surgery. J Clin Endocrinol Metab 85: 3713-3719.
8. Courtney CH, McAllister AS, McCance DR, et al, 2000 Comparison of one week 0900 h serum cortisol, low and standard dose synacthen tests with a 4 to 6 week insulin hypoglycaemia test after pituitary surgery in assessing HPA axis. Clin Endocrinol (Oxf) 53: 431-436.
9. Courtney CH, McAllister AS, Bell PM, et al, 2004 Low- and standard-dose corticotropin and insulin hypoglycemia testing in the assessment of hypothalamic-pituitary-adrenal function after pituitary surgery. J Clin Endocrinol Metab 89: 1712-1717.
10. Klose M, Lange M, Kosteljanetz M, Poulsgaard L, Feldt-Rasmussen U, 2005 Adrenocortical insufficiency after pituitary surgery: an audit of the reliability of the conventional short synacthen test. Clin Endocrinol (Oxf) 63: 499-505.
11. Agha A, Tomlinson JW, Clark PM, Holder G, Stewart PM, 2006 The long-term predictive accuracy of the short synacthen (corticotropin) stimulation test for assessment of the hypothalamic-pituitary-adrenal axis. J Clin Endocrinol Metab 91: 43-47.
12. Siyambalapitiya S, Ibbotson V, Doane A, Ghigo E, Campbell MJ, Ross RJ, 2007 Combining growth hormone releasing hormone-arginine and synacthen testing diminishes the cortisol response. J Clin Endocrinol Metab 92: 853-856.
13. Ambrosi B, Barbetta L, Re T, Passini E, Faglia G, 1998 The one microgram adrenocorticotropin test in the assessment of hypothalamic-pituitary-adrenal function. Eur J Endocrinol 139: 575-579.
14. Giavoli C, Libé R, Corbetta S, et al, 2004 Effect of recombinant human growth hormone (GH) replacement on the hypothalamic-pituitary-adrenal axis in adult GH-deficient patients. J Clin Endocrinol Metab 89: 5397-5401.
15. Dorin RI, Qualls CR, Crapo LM, 2003 Diagnosis of adrenal insufficiency. Ann Intern Med 139: 194-204.
16. Stewart PM, Corrie J, Seckl JR, Edwards CR, Padfield PL, 1988 A rational approach for assessing the hypothalamo-pituitary-adrenal axis. Lancet 8596: 1208-1210.
17. Arlt W, 2009 The approach to the adult with newly diagnosed adrenal insufficiency. J Clin Endocrinol Metab 94: 1059-1067.
18. Pfeifer M, Kanc K, Verhovec R, Kocijancic A, 2001 Reproducibility of the insulin tolerance test (ITT) for assessment of growth hormone and cortisol secretion in normal and hypopituitary adult men. Clin Endocrinol (Oxf) 54: 17-22.
19. Tsatsoulis A, Shalet SM, Harrison J, Ratcliffe WA, Beardwell CG, Robinson EL, 1988 Adrenocorticotrophin (ACTH) deficiency undetected by standard dynamic tests of the hypothalamic-pituitary-adrenal axis. Clin Endocrinol (Oxf) 28: 225-232.
20. Gonzálbez J, Villabona C, Ramón J, et al, 2000 Establishment of reference values for standard dose short synacthen test (250 microgram), low dose short synacthen test (1 microgram) and insulin tolerance test for assessment of the hypothalamo-pituitary-adrenal axis in normal subjects. Clin Endocrinol (Oxf) 53: 199-204.
21. Gleeson HK, Walker BR, Seckl JR, Padfield PL, 2003 Ten years on: Safety of short synacthen tests in assessing adrenocorticotropin deficiency in clinical practice. J Clin Endocrinol Metab 88: 2106-2111.
22. Clark PM, Neylon I, Raggatt PR, Sheppard MC, Stewart PM, 1998 Defining the normal cortisol response to the short Synacthen test: implications for the investigation of hypothalamic-pituitary disorders. Clin Endocrinol (Oxf) 49: 287-292.
23. Plumpton FS, Besser GM, 1968 The adrenocortical response to surgery and insulin-induced hypoglycemia in corticosteroid-treated and normal subjects. Br J Surg 55: 857.
Address for correspondence:
Emanuele Ferrante, MD, Endocrinology and Diabetology Unit, Padiglione Granelli, Via F. Sforza 35, 20122 Milan, Italy, Tel.: +39-2-5503-3355;
Fax: +39-2-50320605; e-mail: leleferrante@gmail.com
Received 19-03-12, Revised 31-05-12, Accepted 06-08-12