Department of Endocrinology, Diabetes and Metabolism, E. Venizelou Hospital, Athens, Greece
FRAX, Fracture probability, Risk assessment, Female, Greece
The creators of the FRAX fracture risk calculator for countries with no national reference values (such as Greece) suggest the use of FRAX from a neighboring country.1,2 For Greeks (considered to run a high risk for osteoporotic fractures), the Italian FRAX is the suggested choice.2 The correlation of FRAX results with and without the use of femoral neck T-scores assessed by DXA is considered to be adequate. The aim of our study was to assess the correspondence of 10-year femoral neck fracture risk with and without the inclusion of femoral neck T-scores implementing the Italian FRAX in Greek women and to evaluate, albeit indirectly, its validity.
We studied 88 consecutive women outpatients (mean age±SD: 58±8 years) with 0-3 FRAX risk factors. All had neck femoral bone mineral density (BMD) assessed by DXA and received only calcium supplements ± vitamin D3 (500 mg/day to1200 mg/day ± 400 IU/day to 1200 IU/day, respectively); all were bisphosphonate-naive. We calculated the 10-year femoral neck fracture risk with and without inclusion of femoral neck T-scores, drafted a Bland-Altman diagram and calculated Cohen’s Kappa coefficient (with the accepted 3% 10-year femoral neck fracture risk as a discriminatory threshold).3,4
Based on DXA measurements, 17 women had a BMD within normal limits, 53 had osteopenia and 18 had various degrees of osteoporosis. Inspection of the Bland-Altman diagram showed that although the correlation of FRAX scores was acceptable for most women, there were nevertheless inconsistencies for a substantial number of them (Figure 1). Discrepancies in FRAX scores with clinical importance (based on the accepted 3% 10-year femoral neck fracture risk) were noted in 21/88 women (24%) (Table 1 ). The Kappa coefficient was low (0.33).4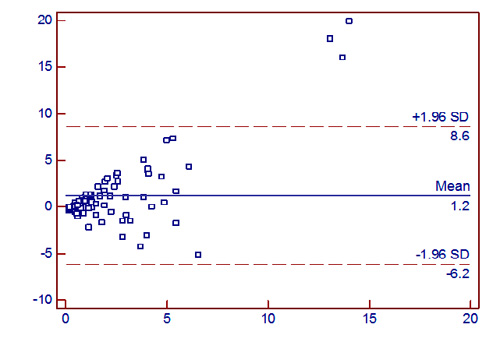
Figure 1. Bland-Altman plot of FRAX estimated 10-year hip fracture rate with and without the inclusion of BMD results.
The correlation of femoral neck fracture risk in Greek women using the Italian version of FRAX with and without the inclusion of femoral neck T-scores was not satisfactory (76%) and was worse than that reported during the validation of FRAX in other countries (approximately 85%-90%).2 This finding is important in view of the proposed use of FRAX as a means to identify low- or high-fracture risk patients who do not require DXA5 and must be taken into consideration when interpreting results in Greek women. A Greek FRAX appears to be necessary.
All the authors declare no conflict of interest.
REFERENCES
1. Kanis JA, Hans D, Cooper C, et al, 2011 Interpretation and use of FRAX in clinical practice. Osteoporos Int 22: 2395-2411.
2. Assessment of osteoporosis at the primary health care level. Report of a WHO scientific group. World Health Organization Collaborating Center for Metabolic Bone Diseases. Sheffield UK: University of Sheffield, 2007.
3. Bland JM, Altman DG, 1986 Statistical methods for assessing agreement between two methods of clinical measurement. Lancet 327: 307-310.
4. Landis RJ, Koch GG, 1977 The measurement of observer agreement for categorical data. Biometrics 33: 159-174.
5. Leslie WD, Morin S, Lix LM, et al, 2012 Fracture risk assessment without bone density measurement in routine clinical practice. Osteoporos Int 23: 75-85.
Address for correspondence:
Ι. Ilias, 2 E. Venizelou Sq, Athens, GR-11521, Greece; e-mail: iiliasmd@yahoo.com
Received 14-12-11, Revised 03-01-12, Accepted 21-01-12