Second Division of Endocrinology, Alexandra Hospital, Athens, Greece
OBJECTIVE: Previous studies showed that insulin stimulated directly calcitonin (Ct) secretion in the pig thyroid, while dexamethasone stimulated the production of Ct and Ct mRNA in medullary thyroid carcinoma (MTC) cell lines. The objective of this study was to investigate if hyperinsulinemia during the oral glucose tolerance test (GTT) stimulates Ct secretion in normal subjects as well as to examine the relationship between serum cortisol and Ct. DESIGN: In 26 normal subjects (9 men and 17 women) with detectable basal serum Ct, aged 22-70 yr [51.5±14.6 (mean±SD), median 55.5], we measured serum or plasma Ct, cortisol, ACTH, insulin, and blood glucose before (0 min) and at 30, 60, 90, and 120 min after ingestion of 75 g glucose. RESULTS: During GTT mean serum cortisol increased slightly by 9.3% at 30 min, whereas mean serum insulin increased 9.4-fold, reaching a peak value at 60 min. Median serum Ct increased by 51% (p<0.001) in normal subjects (by 27% in men, p=0.004, and by 44% in women, p<0.001) at 30 min and remained significantly higher thereafter (up to 120 min) when compared to median baseline level. Regression analysis showed that basal serum cortisol, but not basal serum insulin, was correlated with basal serum Ct (p=0.01). Peak concentrations of Ct were also correlated with peak concentrations of cortisol at 30 min (p<0.001) but not at later time points. Serum insulin was correlated with serum Ct at the serum insulin peak level (60 min), and at later time points (90 and 120 min) (p=0.001). Multiple and simple regression analysis showed that calcitonin-AUC (Area Under Curve) values correlated with insulin-AUC (p=0.003), and also with cortisol-AUC (p=0.02) values, the standardized effect of insulin-AUC on Calcitonin-AUC being greater than that of cortisol-AUC. CONCLUSIONS: These findings suggest that acute hyperinsulinemia during GTT is very likely associated with increased Ct secretion in normal subjects. Serum cortisol within the physiological range was also correlated with serum Ct under basal conditions, as well as during GTT.
Calcitonin secretion, Cortisol, Glucose tolerance test, Hyperinsulinemia, Insulin
INTRODUCTION
Calcium and gastrin are established calcitonin (Ct) secretagogues. Acute hypercalcemia induced by calcium infusion or infusion of the synthetic analogue pentagastrin have long been used in Ct stimulation tests for the diagnosis of medullary thyroid carcinoma (MTC). Care et al1 demonstrated that in the pig insulin administered in the thyroid artery directly stimulated the secretion of Ct; increasing endogenous insulin during glucose administration had a similar effect.1 Dexamethasone stimulated the production and secretion of Ct in a rat MTC cell line2 and also the production of Ct mRNA3 and calcitonin4 in a human MTC cell line. The aim of our work was to investigate if serum Ct in humans is affected by serum insulin and serum cortisol levels. For this purpose, the response of serum Ct to hyperinsulinemia induced during the oral glucose tolerance test (GTT) in normal subjects was evaluated. The present work provides evidence that hyperinsulinemia induced during GTT stimulates secretion of calcitonin as indicated by the correlation between high serum insulin levels and serum Ct during GTT. Serum cortisol within the physiological range was also correlated with serum Ct.
SUBJECTS AND METHODS
The thirty-three healthy normal subjects who participated in the study were divided into two groups. Group A comprised 26 subjects (17 women and 9 men) aged 22-70 yr [51.5±14.6 (mean±SD), median age 55.5], with detectable basal serum Ct and Body Mass Index (BMI) 29.1±5.1 (mean±SD, range 21.5-39.0, median 29.7). The age of normal men was 22-70 yr (50.9±16.4, median 56) and of normal women 26-70 yr (51.8±14.1, median 55). In group B seven healthy women aged 19-62 yr (38±13.8, median 36) with non-detectable basal serum Ct were included. The cut-off value for detectable or non-detectable serum Ct was 2 pg/ml (the functional sensitivity of the assay).
Subjects with fasting blood glucose higher than 125mg/dl were excluded from the study. All subjects were biochemichally euthyroid and had normal results of general blood biochemical tests. None of the participants was taking drugs known to affect glucose metabolism or the secretion of Ct and none was an active smoker. All the subjects were placed on a diet containing at least 250 g carbohydrates per day for 3 days before testing. After an overnight fast an oral GTT was performed at 9.00 AM with 75 g of glucose diluted in 200 ml of water. For an hour before and during the GTT, the participants reclined in a supine position carrying a venous catheter. Blood samples were drawn from an antecubital vein before (0 min) and 30, 60, 90, and 120 minutes after drinking the glucose solution. Blood glucose was measured shortly after collection of the blood specimens. Plasma or serum specimens were stored at -20oC until assayed for insulin, calcitonin, ACTH, and cortisol.
The study protocol was approved by the Scientific Committee of the Alexandra Hospital and informed consent was obtained from all the participants after an explanation of the study to them.
Blood glucose was measured by an automatic analyzer (Cobas Integra 400 plus) and serum insulin by electrochemiluminescence immunoassay (ECLIA- Roche Diagnostics GmbH, D-68298 Mannheim) with analytical sensitivity 0.2 U/L. Serum calcitonin was measured by chemiluminescence - Nichols Advantage calcitonin immunoassay which detects mainly the CT (1-32) monomer5 with a functional sensitivity 2 pg/ml. Plasma ACTH was determined by chemiluminescence-Immulite 2000, DPC, with analytical sensitivity 5 pg/ml (1.1 pmol/L). Serum cortisol was measured by a solid phase RIA (Coat-A-Count, Diagnostic Products Corporation, Los Angeles, CA, USA) with within assay CV 4% at the level of 331 nmol/l. All the measurements for each hormone were performed in the same assay.
Statistical analysis
The changes in each of the various parameters during the oral GTT were evaluated by comparing the values at each time point with the corresponding baseline value using the paired t test for the other parameters and the non-parametric Wilcoxon matched pairs test for serum Ct because of the skewed distribution of serum Ct concentrations. Comparison of serum Ct between men and women was made using the Mann Whitney test. The relationship between two parameters during oral GTT was assessed from three points of view: the baseline values, the peak values, and the Area Under Curve (AUC) 0 to 120 min. Relationships between two variables or between one dependent variable and more than one independent variable were simultaneously evaluated using simple linear regression or multiple regression analysis, respectively. Normality of the data was evaluated using the KS normality test, the D’Agostino & Pearson omnibus normality test, and the Shapiro-Wilk normality test. For the parameters that passed normality tests Pearson correlation coefficients were used, while Spearman correlation coefficients were used for parameters without normal distribution. A two-tailed p<0.05 was considered as significant. Statistical analysis was performed using GraphPad Prism Software, San Diego, CA, USA.
RESULTS
Changes in serum levels of various parameters during oral GTT
In all the subjects with non-detectable basal serum Ct (group B) serum Ct remained non-detectable throughout the GTT and these patients were excluded from further consideration. The results from the 26 normal subjects with detectable basal serum Ct (group A) are discussed in the present study. The numeric results in each of various parameters during the oral GTT are shown in Table 1 , and graphically in Figure 1. 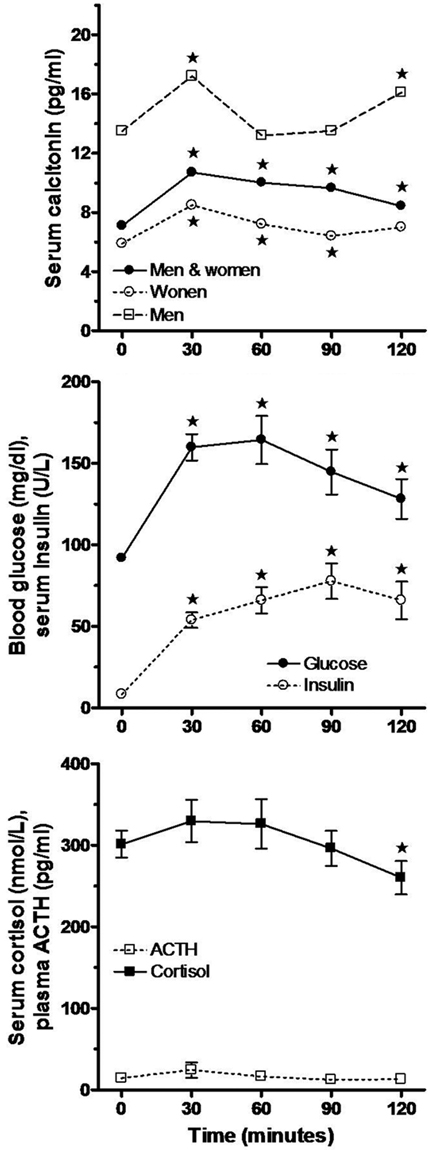
Figure 1. Changes in mean ± SEM of blood glucose, serum insulin, serum cortisol, plasma ACTH, and median value of serum calcitonin during oral GTT in normal subjects with detectable basal serum calcitonin. Serum calcitonin changes are illustrated separately for normal men (n=9), normal women (n=17), and all participants (n=26). The asterisk (*) denotes significant difference from the respective 0 min value (Paired t test or Wilcoxon matched pairs test).
Changes in blood glucose
Baseline blood glucose in all participants varied between 80 and 123 mg/dl and attained a mean peak value at 60 min. Mean blood glucose concentration increased as expected and was significantly different at all the subsequent time points when compared to 0 min (p<0.001).
Changes in serum insulin
Mean serum insulin increased 9.4-fold reaching its peak value at 90 min and was significantly higher at all time points when compared to 0 min (p<0.001).
Changes in serum cortisol
In the entire group of normal subjects (n=26) mean serum cortisol tended to increase to a peak value at 30 min, thereafter falling slowly to levels below the baseline level at 90-120 min. However, the rise of mean serum cortisol was not statistically significant (increase of 9.3% at 30 min), while its fall at 120 min was indicative (p=0.063) (Figure 1). Thirteen participants (8 women and 5 men) in whom serum cortisol increased during GTT were included in a subgroup designated “cortisol-increased”; in these subjects mean serum cortisol increased significantly by approximately 51% at 60 min ( p <0.001) during GTT. In the other 13 subjects (9 women and 4 men) serum cortisol decreased during GTT and they were included in a subgroup designated “cortisol-decreased”; in this subgroup mean serum cortisol decreased significantly by 27% at 60 min (p <0.001) (Figure 2). The serum Ct response to GTT in these two subgroups was also evaluated separately (see below). It should be noted that the increases in mean serum cortisol in the entire group as well as in the subgroups of the participants were within the normal range for morning serum cortisol (Table 1 and Figure 2).
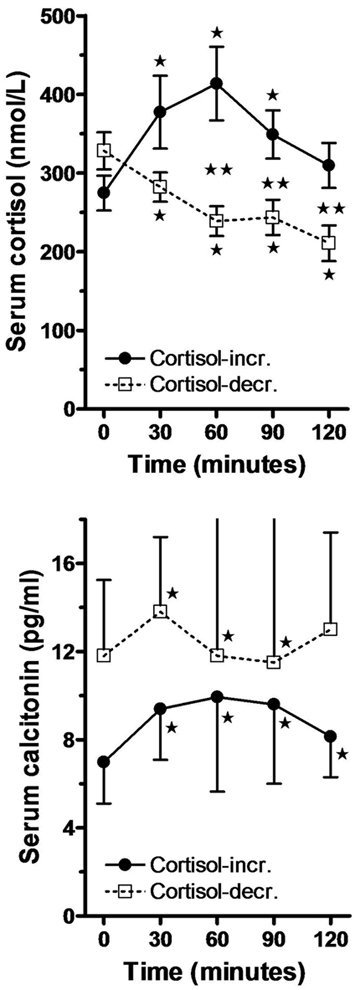
Figure 2. Changes in mean ± SEM of serum cortisol and the median (interquartile range) value of serum calcitonin in two subgroups: Cortisol-incr. signifies subjects in whom serum cortisol increased (n=13), and cortisol-decr. subjects in whom serum cortisol decreased (n=13) during oral GTT. One asterisk denotes significant difference from the corresponding 0 min value (Paired t test or Wilcoxon matched pairs test), and two asterisks denote significant difference between the corresponding values of the two groups at each time point (t test or Mann Whitney test).
Changes in plasma ACTH
The change of mean plasma ACTH, which was similar to that of serum cortisol, was not statistically significant throughout the GTT.
Changes in serum calcitonin
Basal median serum Ct in normal men (n=9) was indicatively higher (p=0.059) when compared to basal median serum Ct in normal women (n=17), and during GTT it remained significantly higher in normal men when compared to normal women at 30 min (p=0.033), 90 min (p=0.056), and 120 min (p=0.015). The median calcitonin-AUC in normal men was also significantly higher when compared to median calcitonin-AUC in normal women (p=0.052) (Mann Whitney test).Changes in median serum Ct concentration during GTT are shown in the entire group (n=26) and separately in normal men and women in Table 1, and graphically in Figure 1.
In the entire group of normal subjects (n=26) median serum Ct increased significantly by approximately 51% at its peak level at 30 min (p<0.001) and remained significantly higher thereafter throughout the GTT when compared to 0 min (p<0.001) (Wilcoxon matched pairs test); similarly, median serum Ct increased significantly by 27% (p=0.004) in normal men (n=9) and by 44% in normal women (n=17, p<00001) (Table 1 and Figure 1). In the subgroup called “cortisol-increased”, median serum Ct increased significantly by 42% (p<0.001) at 30 min compared to an increase by 17% (p=0.003) in the subgroup called “cortisol-decreased” (Figure 2).
Relation of serum calcitonin with serum levels of various independent predictor variables during oral GTT
In the entire group of normal subjects (n=26) multiple regression analysis of the baseline serum Ct values simultaneously on the basal values of serum insulin, cortisol, plasma ACTH, and blood glucose resulted in a coefficient of determination R2=0.30 (p=0.10) (Table 2). By eliminating one by one the non-significant independent variables it was concluded that the only significant predictor of basal serum Ct was basal serum cortisol with a regression coefficient R2=0.24 (p=0.01) (Table 3). Similarly, multiple regression yielded for the peak (30 min) values R2=0.47, p=0.007, for the 60 min values R2=0.48, p=0.006 , for the 90 min values R2=0.38, p=0.035, and for the 120 min values R2=0.33, p=0.071 (Table 2). However, after the elimination procedure the only significant predictor of the peak (30 min) serum Ct was found to be the 30 min serum cortisol with a regression coefficient R2=0.42 (p <0.001), the only significant predictor of the 60 min serum Ct proved to be the 60 min serum insulin with a regression coefficient R2=0.40 (p=0.001), the only significant predictor of the 90 min serum Ct was found to be the 90 min serum insulin with a regression coefficient R2=0.27 (p=0.006), and the only significant predictor of the 120 min serum Ct was serum insulin with a regression coefficient R2=0.14, p=0.06 (Table 3).Using multiple regression analysis, a significant relationship was also found between the calcitonin-AUC values and the AUC values of the four independent variables (R2=0.48, p=0.007), but after a stepwise elimination procedure of the non-significant variables, a model was reached with two significant predictors of the calcitonin-AUC, namely insulin-AUC and cortisol-AUC (R2=0.43, p=0.002). The standardized equation of this model was: calcitonin-AUC=0.474 insulin-AUC + 0.366 cortisol-AUC; the values of the standard partial regression coefficients (beta-coefficients) indicate that the standardized effect of insulin-AUC on calcitonin-AUC was greater than that of cortisol-AUC in this model.
The standard partial regression coefficients in the standardized form of the above six multiple regression equations are summarized in Table 2. It can be seen that in the regression equations concerning 0 min and 30 min, the beta coefficient for serum cortisol was the highest among the partial standard coefficients of the four independent variables considered here, whereas in the equations concerning values at 60 min, 90 min, 120min, and the AUC values, the beta coefficient for serum insulin was the highest. These findings imply that in normal subjects serum cortisol had the greatest standardized effect among the four predictor variables on basal serum Ct (at 0 min) and early during GTT (at 30 min), whereas serum insulin had the greatest standardized effect on serum Ct during a later phase of the test (60 through 120 min). Thus, at 90 min, for example, for an increase of one standard deviation of basal serum insulin there will be an increase of basal serum Ct by roughly two thirds of its standard deviation, the other independent variables being kept constant (see Table 2).
The results of simple linear correlation between various parameters are summarized in Table 3. Serum Ct at all time points passed at least one of the three normality tests. The lack of strong skewness in the Ct values is presumably due to the fact that subjects with non-detectable Ct values were excluded. Serum insulin, cortisol, and blood glucose values also passed at least one of the normality tests, while plasma ACTH failed to pass the normality tests. Pearson correlation coefficients were applied among all the parameters except for ACTH. Serum ACTH was correlated with other parameters using Spearman correlation coefficients. It is noteworthy that in the entire group of normal subjects serum Ct was significantly positively correlated with serum cortisol at baseline and at 30 min during GTT, whereas serum Ct was significantly positively correlated with serum insulin at a later phase of GTT (at 60, 90, and 120 min). The calcitonin-AUC was significantly positively correlated with the insulin-AUC as well as with the cortisol-AUC (Table 3, Figure 3). These results are in agreement with the multiple regression results of serum Ct simultaneously on the four independent variables (Table 2). In the normal participants, the regression coefficients R2=0.24 for 0 min values, R2=0.42 for 30 min values, and R2=0.22 for AUC values indicate that 24% of the variance of Ct at 0 min, 42% at 30 min, and 22% during the whole duration of GTT was due to serum cortisol. On the other hand, the regression coefficients R2=0.40 at 60 min, R2=0.27 at 90 min, and R2=0.30 for AUC indicate that 40%, 27%, and 30% of the variance of serum Ct was due to serum insulin at these times, respectively (Table 3).
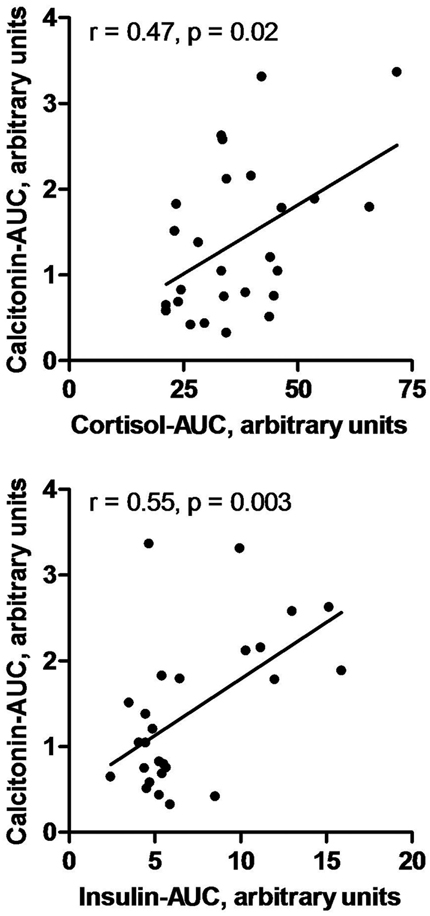
Figure 3. Correlation of calcitonin-AUC with cortisol-AUC, and with insulin-AUC during oral GTT in normal subjects (n=26). The contribution of insulin-AUC to the variance of calcitonin-AUC is greater than that of cortisol-AUC.
DISCUSSION
Insulin has been shown to stimulate directly Ct secretion in the pig thyroid.1 Dexamethasone has also been shown to stimulate Ct secretion in vitro in a rat2 as well as in a human4 MTC tumor cell line. Dexamethasone also increased the production of Ct mRNA in a human MTC cell line.3 The aim of this study was to investigate the response of serum Ct to hyperinsulinemia induced during an oral GTT in normal subjects and also to assess the relationship between serum Ct and serum cortisol.
In the normal participants in this study blood glucose and serum insulin increased as expected during an oral GGT. In the entire group mean serum cortisol decreased below its baseline levels at 90-120 min as described previously during GTT;6,7 however, in the entire group of normal subjects of our study a small increase of mean serum cortisol occurred at 30 min, which is not described in previous reports.6,7 In fact, in 50% of the participants mean serum cortisol increased significantly within the normal range of morning serum cortisol, and in the remaining subjects mean serum cortisol decreased significantly during GTT. The reason for these discrepancies is not evident. It is possible that the increase in mean serum cortisol in certain participants in this study may be related to the stress of the procedure affecting these subjects but not others.
The data of the present work showed that during oral GTT median serum Ct increased significantly by approximately 51% in a group of normal subjects including men and women with detectable basal serum Ct, attaining a peak value at 30 min after ingestion of the glucose load. This rapid change implies that the mechanism of Ct stimulation very likely is not genomic. Basal median serum Ct as well as median calcitonin-AUC were higher in men when compared to women. These results are in agreement with the findings of d’ Herbomez et al,8 who reported that serum Ct levels are higher in normal men when compared to women. In the subgroup of participants in whom serum cortisol increased during GTT, serum Ct increased significantly by 42% at 30 min compared to an increase by 17% in the participants in whom serum cortisol decreased. These findings indicate that the increase in serum Ct may be related to the increase in serum cortisol during GTT.
The simple linear regression analysis results in the normal participants in the present study demonstrated that serum Ct was significantly correlated with serum cortisol only before (at 0 min) and 30 min after the ingestion of glucose, whereas serum Ct was significantly correlated with serum insulin only at 60 min, 90 min, and 120 min (Table 3). These results are in agreement with the multiple regression analysis results which showed that the standardized effect of serum cortisol on serum Ct was higher than that of insulin early during GTT (at 0 and 30 min), while the standardized effect of serum insulin on serum Ct was higher than that of cortisol later, at 60, 90 min, and 120 min (Table 2A). Insulin-AUC and cortisol-AUC were both significantly correlated with calcitonin-AUC, the standardized effect of insulin-AUC on calcitonin-AUC being higher than that cortisol-AUC (Table 2 and 3).
The positive relationship between serum cortisol and serum Ct at 0 min indicates that there may be a long-term effect of cortisol on Ct under basal conditions in normal subjects, probably mediated by a genomic mechanism.2,3 However, the positive relationship of the peak values of serum Ct with the peak values of serum cortisol at 30 min and the co-occurrence of the peak serum concentrations of these two compounds imply that there was also an additional rapid effect of cortisol on Ct during GTT, presumably via a non-genomic mechanism,9 although the mean increase of serum cortisol at 30 min was small in the entire group of normal participants in this study. In favor of this view is the fact that progesterone, another steroid hormone, has been shown to stimulate Ct secretion from TT cells in vitro by a non-genomic rapid mechanism.10 An alternative view is that the effect of cortisol on Ct at 30 min is not a new activity but an extension of the basal effect of cortisol and the effect at 30 min is the result of synergy between cortisol and the rising insulin.
A significant positive relationship between high serum insulin and serum Ct in normal participants was evident with some delay (after min 60 during GTT). This was apparently due to the relatively slow increase of serum insulin which reached a plateau after 60 min. The relationships between serum cortisol and serum Ct early on, and between serum insulin and serum Ct later during GTT, were substantial since approximately 25-45 percent of the variance of serum Ct can be ascribed to cortisol and 30-40 percent to insulin.
The data of our work suggest the existence of an effect of endogenous hyperinsulinemia on Ct secretion in humans but cannot elucidate whether this effect is direct or possibly mediated also by other pancreatic or gastrointestinal peptides secreted during oral GTT. The results of the experiments carried out by Care et al,1 who demonstrated that insulin injected in the thyroid artery of pigs can stimulate directly Ct secretion, point to a direct effect. The data of the present work showed that serum insulin was not correlated with serum Ct in the basal (fasting) state, but only during induced acute hyperinsulinemia. Serum calcium, the classical Ct secretagogue, seems to behave in an analogous fashion: a constant serum calcium level, even chronic primary hyperparathyroidism-related hypercalcemia does not cause hypercalcitoninemia,11 while acute hypercalcemia is a classical Ct stimulator. As discussed by Clowes et al,12 it is not clear whether Ct secretion increases postprandially. However, it should be noted that the assays used for measuring Ct in the older literature concerning postprandial secretion of Ct12 were probably not as sensitive and specific for the Ct monomer as the assay used in the present study.
In the present study we distinguished normal participants with undetectable basal serum Ct from normal subjects with detectable Ct and excluded them from the study because, in our experience, a substantial proportion of normal subjects with undetectable serum Ct fail to respond with a measurable increase of serum Ct after stimulation with calcium infusion.
In conclusion, we found that under basal conditions there is a positive relationship between serum Ct and serum cortisol within the physiological range in normal subjects with detectable basal serum Ct. Serum Ct increased during oral GTT, and the positive relationship between serum Ct and serum insulin implies that Ct secretion was very likely stimulated by the induced endogenous acute hyperinsulinemia. Since both serum insulin-AUC and serum cortisol-AUC were positively correlated with calcitonin-AUC, it seems probable that there is a synergistic effect of insulin and cortisol on Ct secretion during GTT. Physicians should be aware that in states of acute hyperinsulinemia or high but still within normal range serum cortisol, serum calcitonin values may be higher than expected without the presence of these conditions.
No conflict of interest or financial support declared.
REFERENCES
1. Care AD, Abbas SK, Pell J, Seitz PK, Cooper CW, 1998 Stimulatory effect of insulin on calcitonin secretion. Horm Metab Res 30: 200-205.
2. Muszynaski M, Birnbaum RS, Roos BA, 1983 Glucocorticoids stimulate the production of preprocalcitonin-derived secretory peptides by a rat medullary thyroid carcinoma cell line. J Biol Chem 258: 11678-11683.
3. Cote GJ, Gagel RF, 1986 Dexamethasone differentially affects the levels of calcitonin and calcitonin gene-related peptide mRNAs expressed in a human medullary thyroid carcinoma cell line. J Biol Chem 261: 15524-15528.
4. Lazaretti-Castro M, Grauer A, Raue F, Ziegler R, 1990 1, 25-Dihydroxyvitamin D3 suppresses dexamethasone effects on calcitonin secretion. Mol Cell Endocrinol 71: R13-18.
5. Papapetrou PD, Polymeris A, Karga H, Vaiopoulos G, 2006 Heterophilic antibodies causing falsely high serum calcitonin values. J Endocrinol Invest 29: 919-923.
6. Fernández-Real JM, Ricart W, Casamitjana R, 1997 Lower cortisol levels after oral glucose in subjects with insulin resistance abdominal obesity. Clin Endocrinol 47: 583-588.
7. Cakir M, Sari R, Tosun O, Karayalcin U, 2005 Cortisol levels during glucose tolerance test in lean and obese women. Endocr Res 31: 213-218.
8. d’Herbomez M, Caron P, Bauters C, et al; French Group GTE (Groupe des Tumeurs Endocrines) 2007 Reference range of serum calcitonin levels in humans: influence of calcitonin assays, sex, age, and cigarette smoking. Eur J Endocrinol 157: 749-755.
9. Stahn C, Buttgereit F, 2008 Genomic and nongenomic effects of glucocorticoids. Nat Clin Pract Rheumatol 4: 525-533.
10. Lu CC, Tsai SC, 2007 The cyclic AMP-dependent protein kinase A pathway is involved in progesterone effects on calcitonin secretion from TT cells. Life Sci 81: 1411-1420.
11. Conte-Devois B, Morlet-Barla N, Roux F, Sebag F, Henry JF, Niccoli P, 2010 Could primary hyperparathyreoidism-related hypercalcemia induce hypercalcitoninemia? Horm Res Pædiatr 73: 372-375.
12. Clowes JA, Khosla S, Eastell R, 2005 Potential role of pancreatic and enteric hormones in regulating bone turnover. J Bone Miner Res 20: 1497-1506.
Address for correspondence:
Peter D. Papapetrou, 51 Panagiotou Str., Papagou, 156 69 Athens, e-mail: pdpap@otenet.gr
Received 16-05-11, Revised 23-06-11, Accepted 10-07-11